Thread
Probability Theory is a fundamental skill for Machine Learning, but most people don't know this:
You learned the most powerful technique to solve probability problems when you were 7!
You just don't know it. Yet.
Here it is:
You learned the most powerful technique to solve probability problems when you were 7!
You just don't know it. Yet.
Here it is:
99% of people try to remember formulas, rules, and how to apply them.
This works, but there's a better way:
Understanding probabilities from first principles.
You can turn probability problems into the most basic operation we all learned when we were kids:
Counting.
This works, but there's a better way:
Understanding probabilities from first principles.
You can turn probability problems into the most basic operation we all learned when we were kids:
Counting.
I'll show you using a story from @brilliantorg's Data Science Foundations, a platform that teaches from first principles.
They break fundamentals into core building blocks organized in bite-sized lessons.
You can see their courses at brilliant.org/svpino.
Here is the story:
They break fundamentals into core building blocks organized in bite-sized lessons.
You can see their courses at brilliant.org/svpino.
Here is the story:
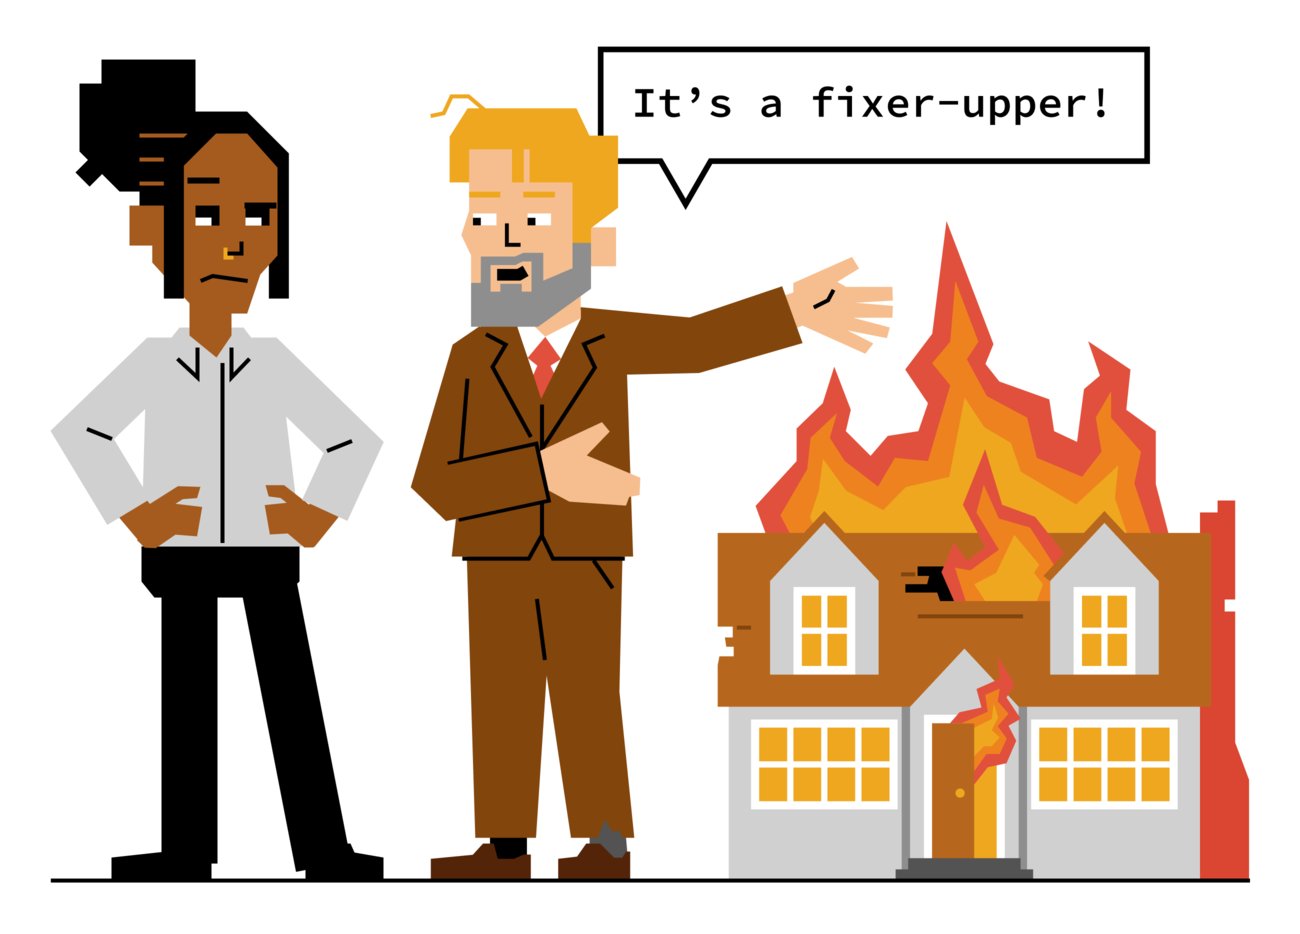
This is the story of Greg, a real estate agent.
Every weekend he meets one client and sells a house 1/3 of the time. One time every four weekends, he meets with two clients.
What's the probability Greg doesn't make a sale one of the days he only has one appointment?
Every weekend he meets one client and sells a house 1/3 of the time. One time every four weekends, he meets with two clients.
What's the probability Greg doesn't make a sale one of the days he only has one appointment?
We are not going to solve this problem using formulas. Instead, let's do basic counting!
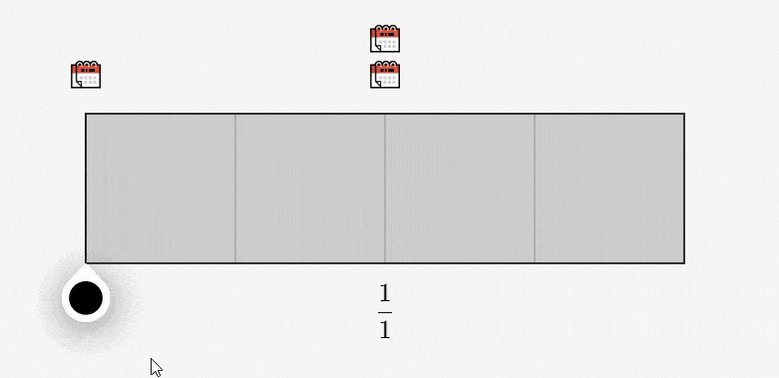
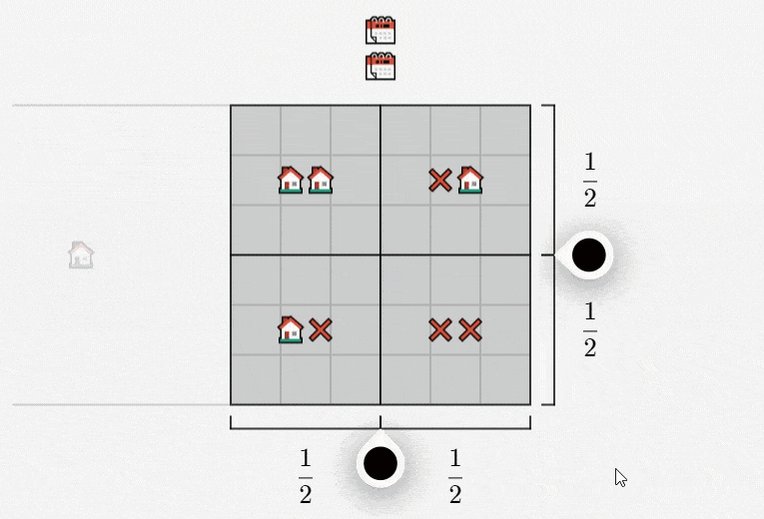
Here is a grid with 4 squares.
3 of the squares represent when Greg meets a single client. The other square represents when Greg meets two clients.
Here is a grid with 4 squares.
3 of the squares represent when Greg meets a single client. The other square represents when Greg meets two clients.
Let's now focus on the section where Greg meets a single client.
We have two possibilities:
• Greg makes the sale
• Greg doesn't make the sale
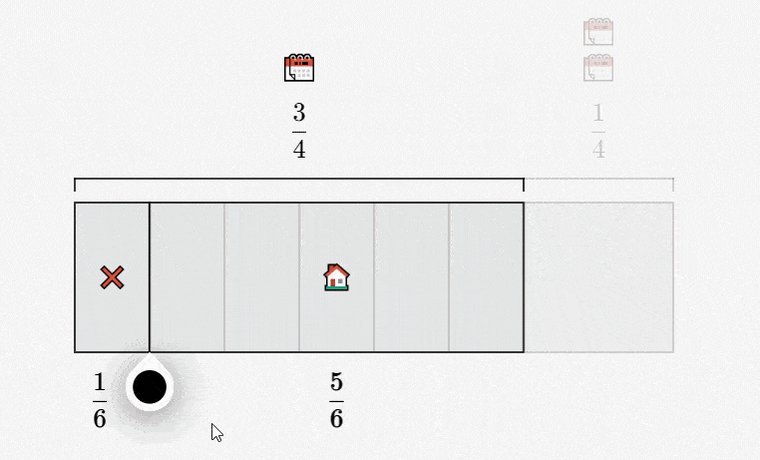
We know he sells the house with a probability of 1/3 and doesn't with 2/3.
Here is the new sub-divided grid.
We have two possibilities:
• Greg makes the sale
• Greg doesn't make the sale
We know he sells the house with a probability of 1/3 and doesn't with 2/3.
Here is the new sub-divided grid.
What's the probability Greg gets one appointment and doesn't make a sale?
We can now count using our grid:
We have 8 total sections, of which 4 correspond to Greg not making a sale when he meets with one client.
Therefore, the probability is 4/8 or 1/2.
We can now count using our grid:
We have 8 total sections, of which 4 correspond to Greg not making a sale when he meets with one client.
Therefore, the probability is 4/8 or 1/2.
Another way to find this answer:
• 3/4 of the grid corresponds to one appointment
• 2/3 of that section corresponds to not selling a house
So the relative area of outcomes where Greg gets one appointment and makes no sale from it is:
3/4 x 2/3 = 1/2
• 3/4 of the grid corresponds to one appointment
• 2/3 of that section corresponds to not selling a house
So the relative area of outcomes where Greg gets one appointment and makes no sale from it is:
3/4 x 2/3 = 1/2
But we still don't know what happens when Greg meets two clients.
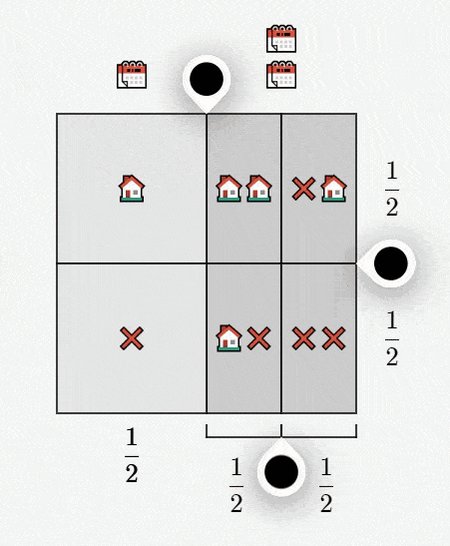
Let's zoom in on the right side of our grid and represent Greg's probability of closing a deal as 1/3.
Vertically, Greg sells to the first client; horizontally, Greg sells to the second client.
Let's zoom in on the right side of our grid and represent Greg's probability of closing a deal as 1/3.
Vertically, Greg sells to the first client; horizontally, Greg sells to the second client.
We now have a clear picture of every possible outcome.
Remember, we want to solve the problems by counting!
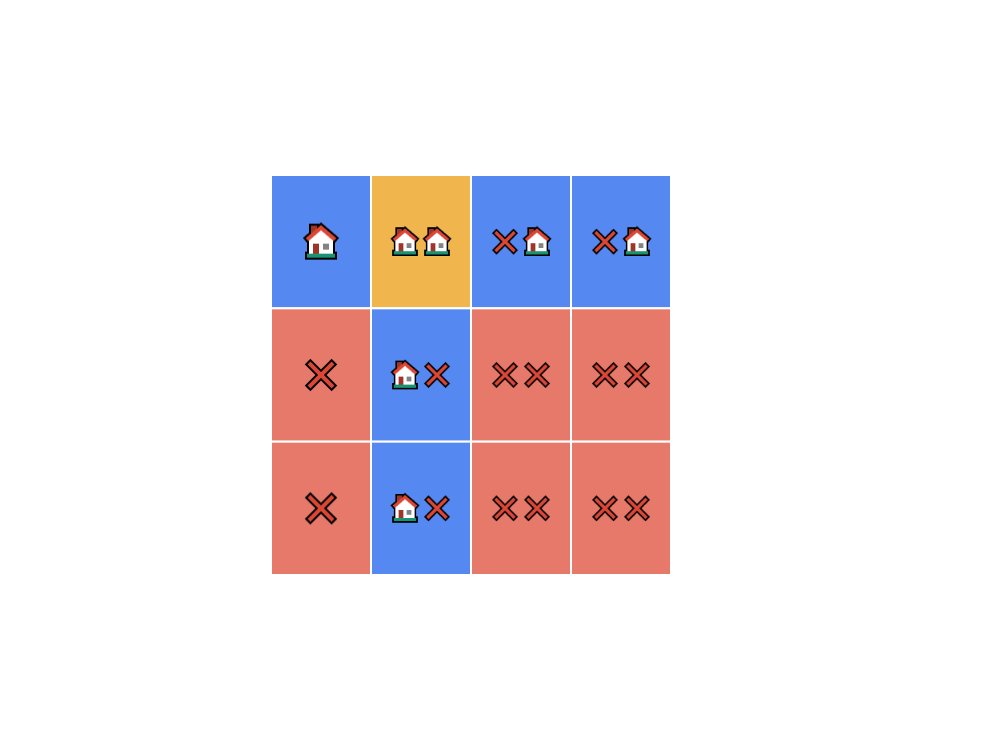
We can split this grid into equally sized rectangles to make our life easier.
Let's use the size of the square representing Greg selling two houses.
Remember, we want to solve the problems by counting!
We can split this grid into equally sized rectangles to make our life easier.
Let's use the size of the square representing Greg selling two houses.
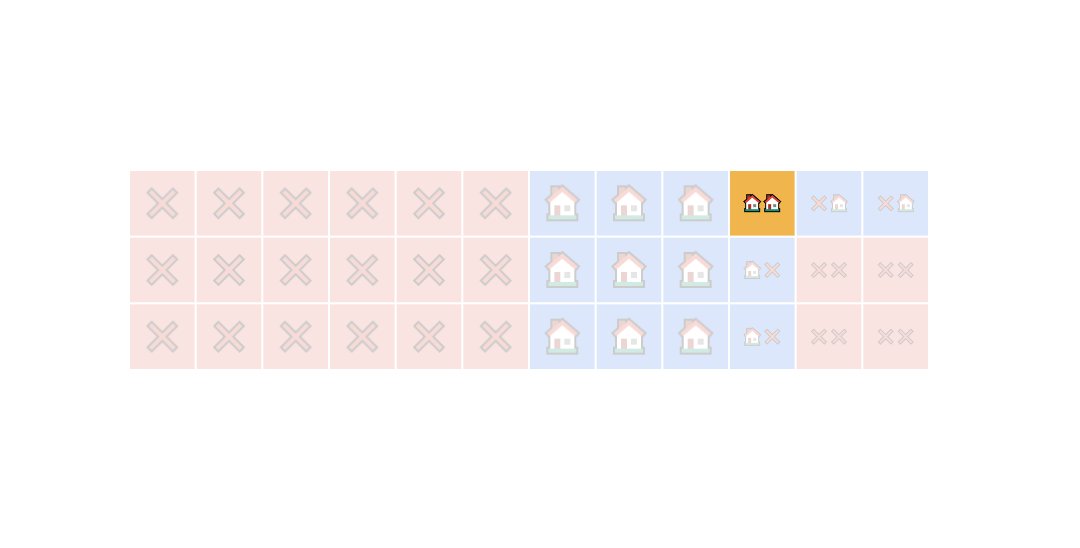
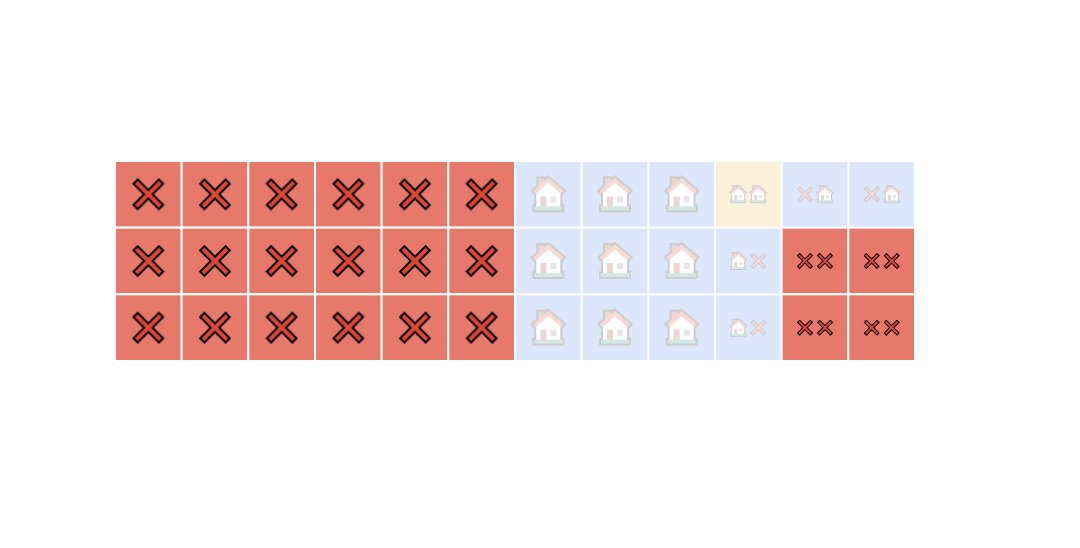
Here is the same grid, but now it's much simpler to count different outcomes.
Here is the meaning of the colors:
• Red: Greg doesn't make a sale.
• Blue: Greg sells one house.
• Yellow: Greg sells two houses.
Here is the meaning of the colors:
• Red: Greg doesn't make a sale.
• Blue: Greg sells one house.
• Yellow: Greg sells two houses.
What's the probability Greg sells 2 homes on a given weekend?
Let's count:
There are 36 total squares.
One of these squares represents Greg selling two houses, the yellow one.
Therefore, the answer to the question is 1/36.
Let's count:
There are 36 total squares.
One of these squares represents Greg selling two houses, the yellow one.
Therefore, the answer to the question is 1/36.
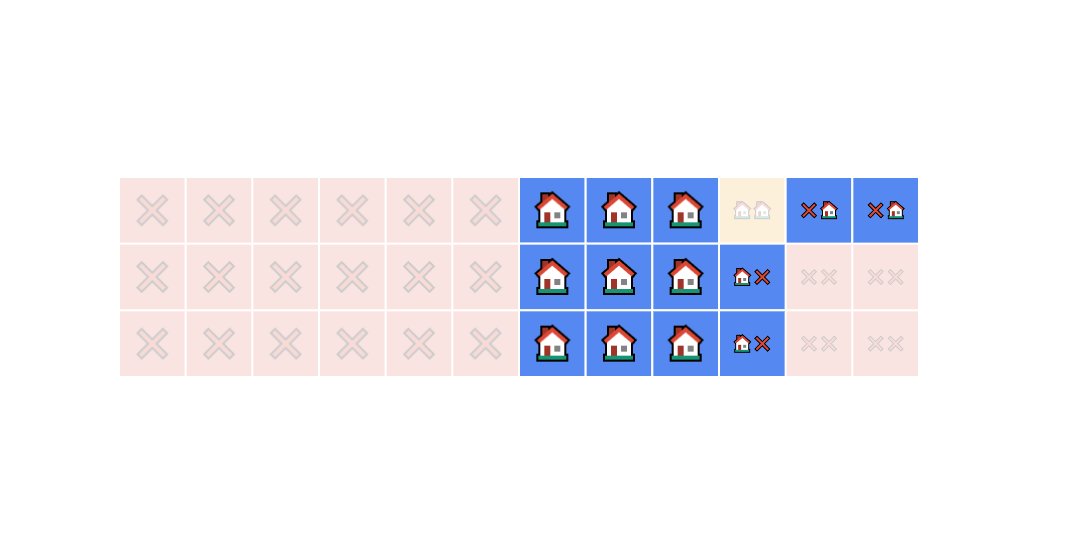
What's the probability Greg sells 1 home on a given weekend?
This time we can count the blue squares.
We have 13 squares. Therefore, the answer to the question is 13/36.
This time we can count the blue squares.
We have 13 squares. Therefore, the answer to the question is 13/36.
What's the probability Greg sells no homes on a given weekend?
Same process: we count how many red squares we have in the grid and divide by the total number of squares.
There are 22 red squares.
The answer to the question is 22/36 = 11/18.
Same process: we count how many red squares we have in the grid and divide by the total number of squares.
There are 22 red squares.
The answer to the question is 22/36 = 11/18.
Let's finalize with a much more complex question.
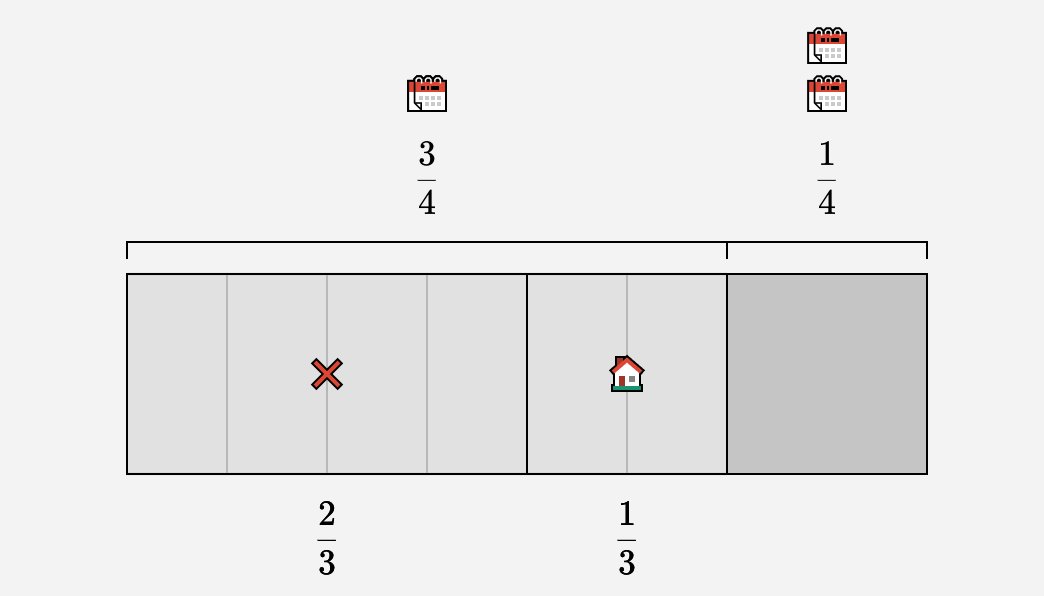
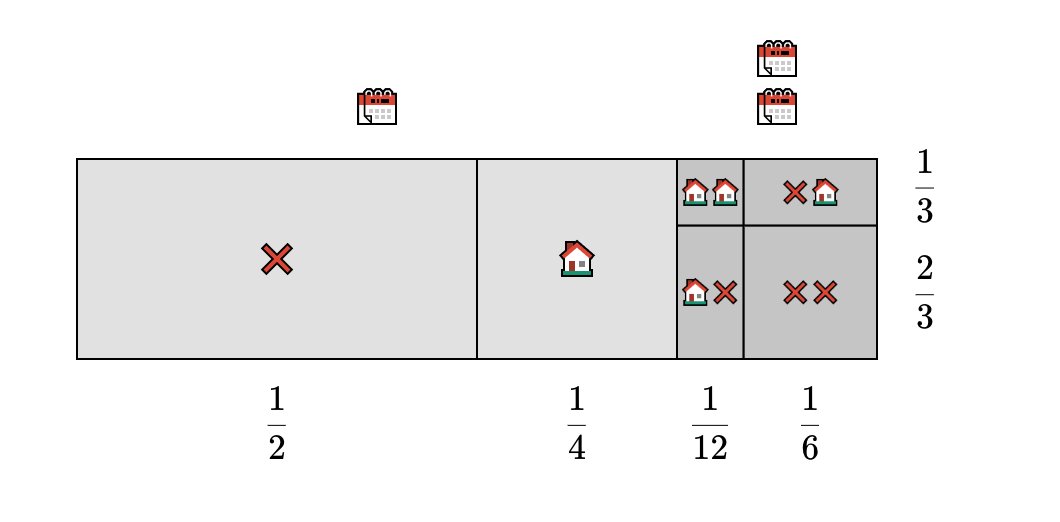
What happens if we give Greg two clients 3/4 of the time instead of 1/4?
Here is the new grid.
Notice that Greg still sells a house with a probability of 1/3, but he now gets two appointments 3/4 of the time.
What happens if we give Greg two clients 3/4 of the time instead of 1/4?
Here is the new grid.
Notice that Greg still sells a house with a probability of 1/3, but he now gets two appointments 3/4 of the time.
We can now split the grid into 12 equal-sized squares to answer our question:
• Greg will sell 2 houses with a probability of 1/12.
• Greg will sell 1 house with a probability of 5/12.
• Greg will sell 0 houses with a probability of 1/2.
And we did it all by counting!
• Greg will sell 2 houses with a probability of 1/12.
• Greg will sell 1 house with a probability of 5/12.
• Greg will sell 0 houses with a probability of 1/2.
And we did it all by counting!
In summary, the probability of seeing some scenario play out is the relative fraction of all outcomes that make it happen.
Returning to first principles is one of the most powerful ways to understand a subject.
Returning to first principles is one of the most powerful ways to understand a subject.
This story is part of Brilliant's "Introduction to Probabilities" course.
Brilliant is different:
They offer fully interactive courses that teach you from first principles.
Click here for 30 free days + 20% off an annual membership: brilliant.org/svpino!
Brilliant is different:
They offer fully interactive courses that teach you from first principles.
Click here for 30 free days + 20% off an annual membership: brilliant.org/svpino!
Mentions
See All
Akshay 🚀 @akshay_pachaar
·
Mar 3, 2023
Great thread! 👏
Sumanth @Sumanth_077
·
Mar 3, 2023
Great thread Santiago💯


