Thread
1/
Get a cup of coffee.
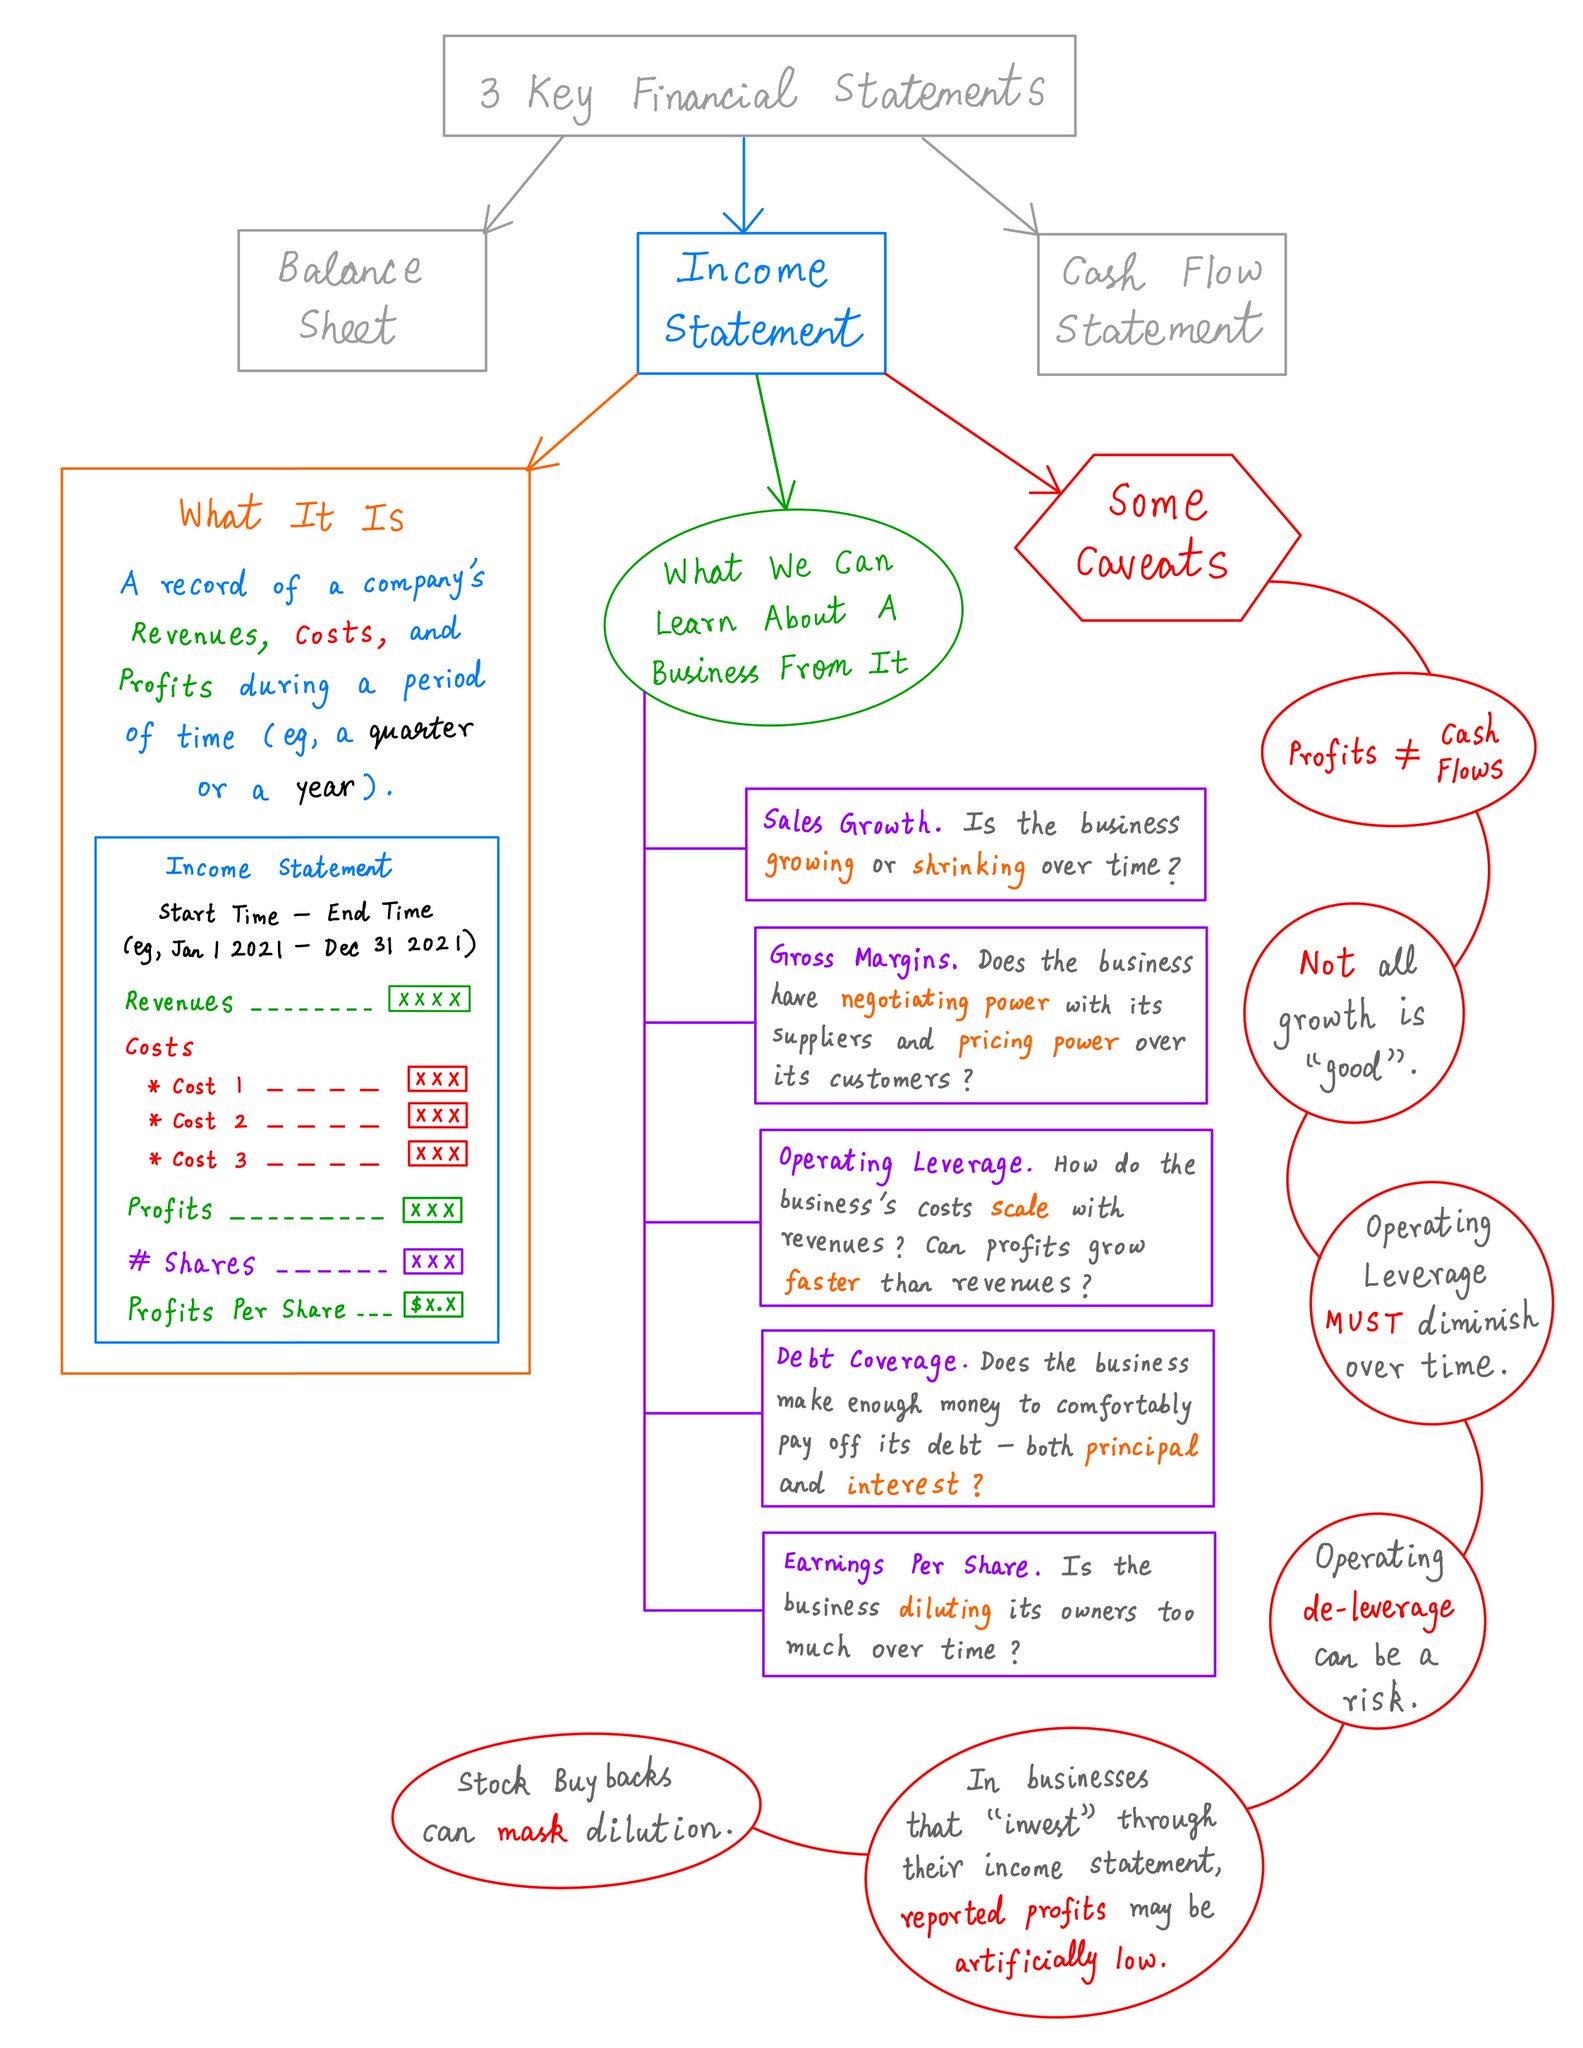
In this thread, I'll walk you through Income Statements:
a) What they are,
b) What key things about a business we can learn from them, and
c) Some important caveats we should keep in mind while reading them.
Get a cup of coffee.
In this thread, I'll walk you through Income Statements:
a) What they are,
b) What key things about a business we can learn from them, and
c) Some important caveats we should keep in mind while reading them.
2/
An Income Statement is just a *record* of how much money a business made (or lost) during a particular period of time -- eg, a quarter or a year.
At its core, this is as simple as:
Profits for the period = Revenues - Costs
An Income Statement is just a *record* of how much money a business made (or lost) during a particular period of time -- eg, a quarter or a year.
At its core, this is as simple as:
Profits for the period = Revenues - Costs
3/
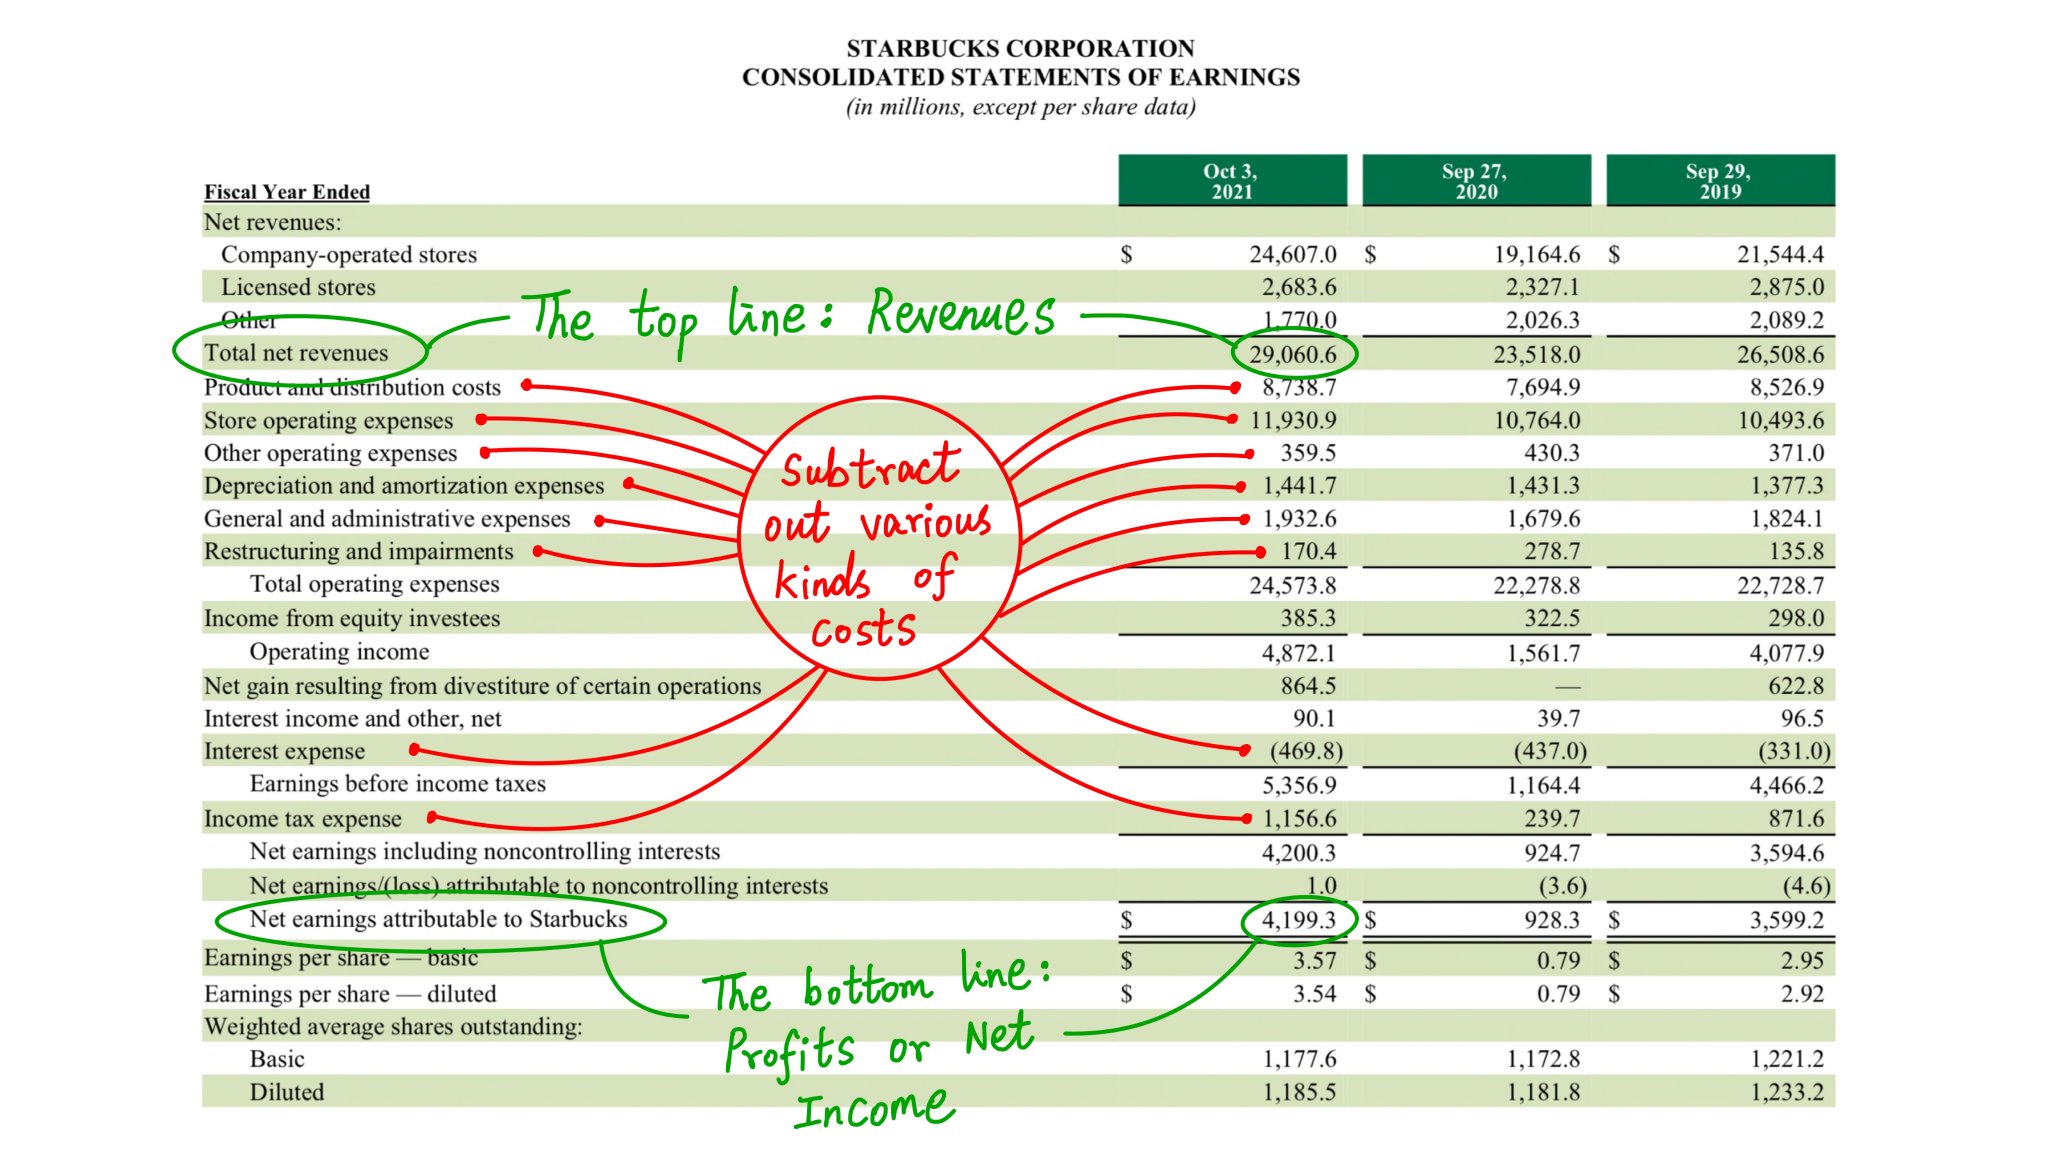
So, at the top of the Income Statement, we have Revenues (ie, Sales). This is the "top line".
And as we go down the statement, we subtract out various Costs.
This leaves us with Profits (or Net Income) at the bottom of the statement. This is the "bottom line".
So, at the top of the Income Statement, we have Revenues (ie, Sales). This is the "top line".
And as we go down the statement, we subtract out various Costs.
This leaves us with Profits (or Net Income) at the bottom of the statement. This is the "bottom line".
4/
Here's an example: Starbucks's Income Statement for the ~1 year period that started on Sep 28, 2020 and ended on Oct 3, 2021.
Here's an example: Starbucks's Income Statement for the ~1 year period that started on Sep 28, 2020 and ended on Oct 3, 2021.
5/
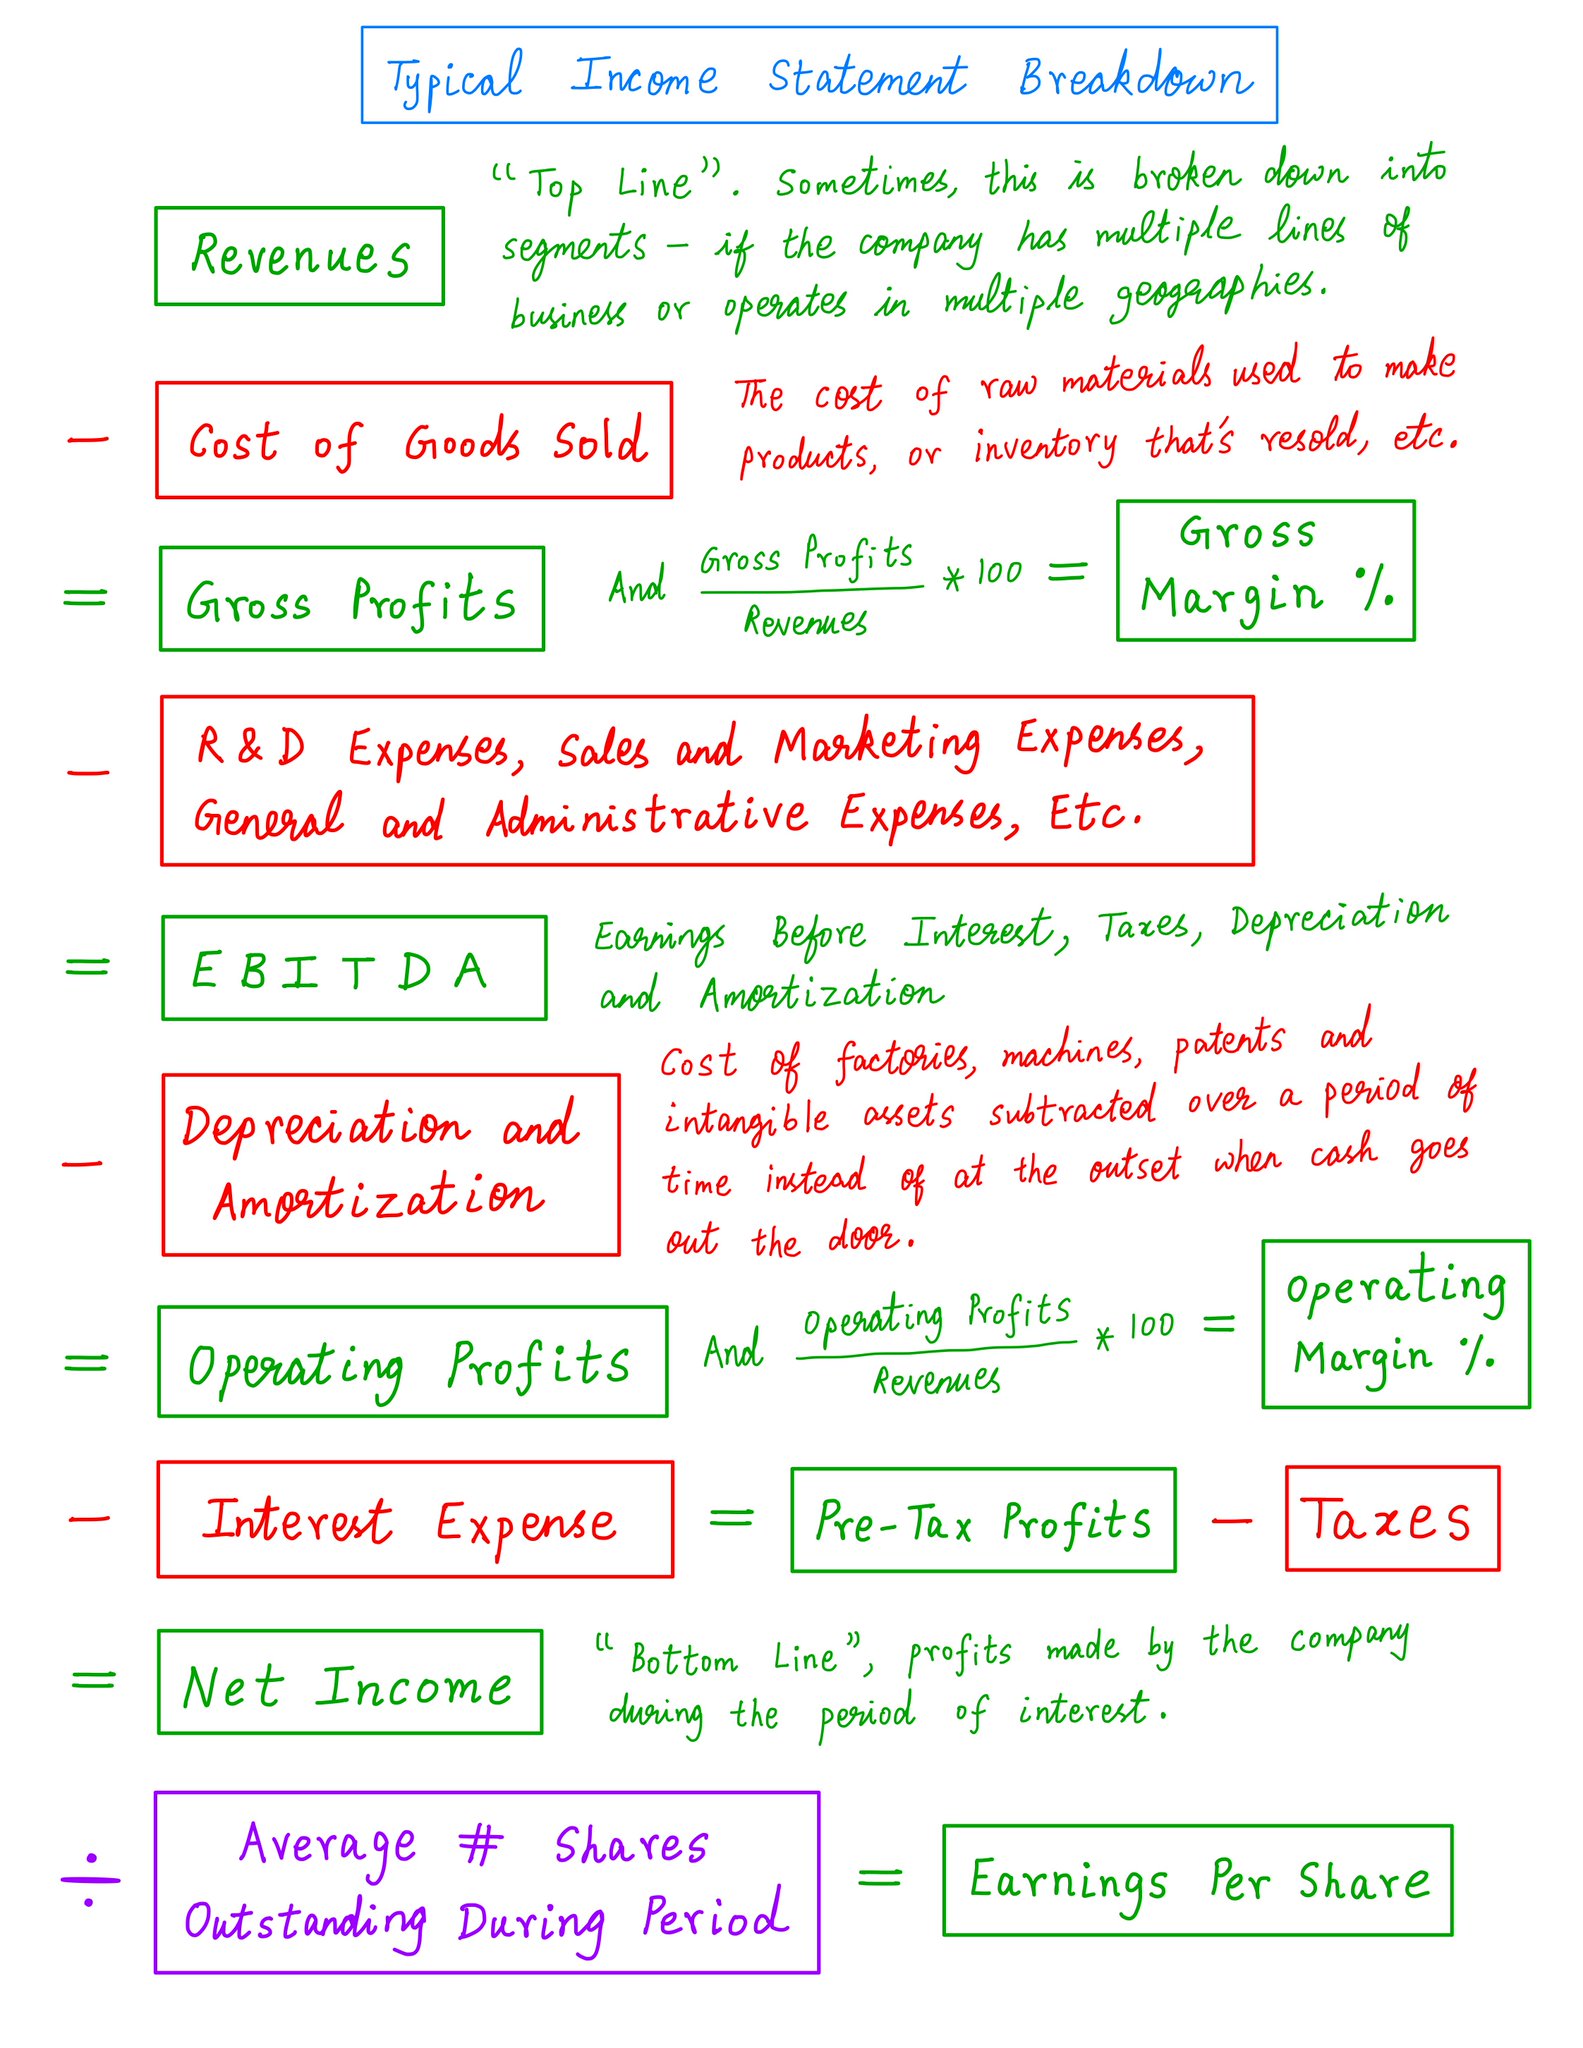
In addition to Revenues, Costs, and Profits, Income Statements also contain a few other quantities of interest to investors.
Typically, these are: Gross Profits, Gross Margin, EBITDA, Operating Profits, Operating Margin, Earnings Per Share, etc.
Here's a typical breakdown:
In addition to Revenues, Costs, and Profits, Income Statements also contain a few other quantities of interest to investors.
Typically, these are: Gross Profits, Gross Margin, EBITDA, Operating Profits, Operating Margin, Earnings Per Share, etc.
Here's a typical breakdown:
6/
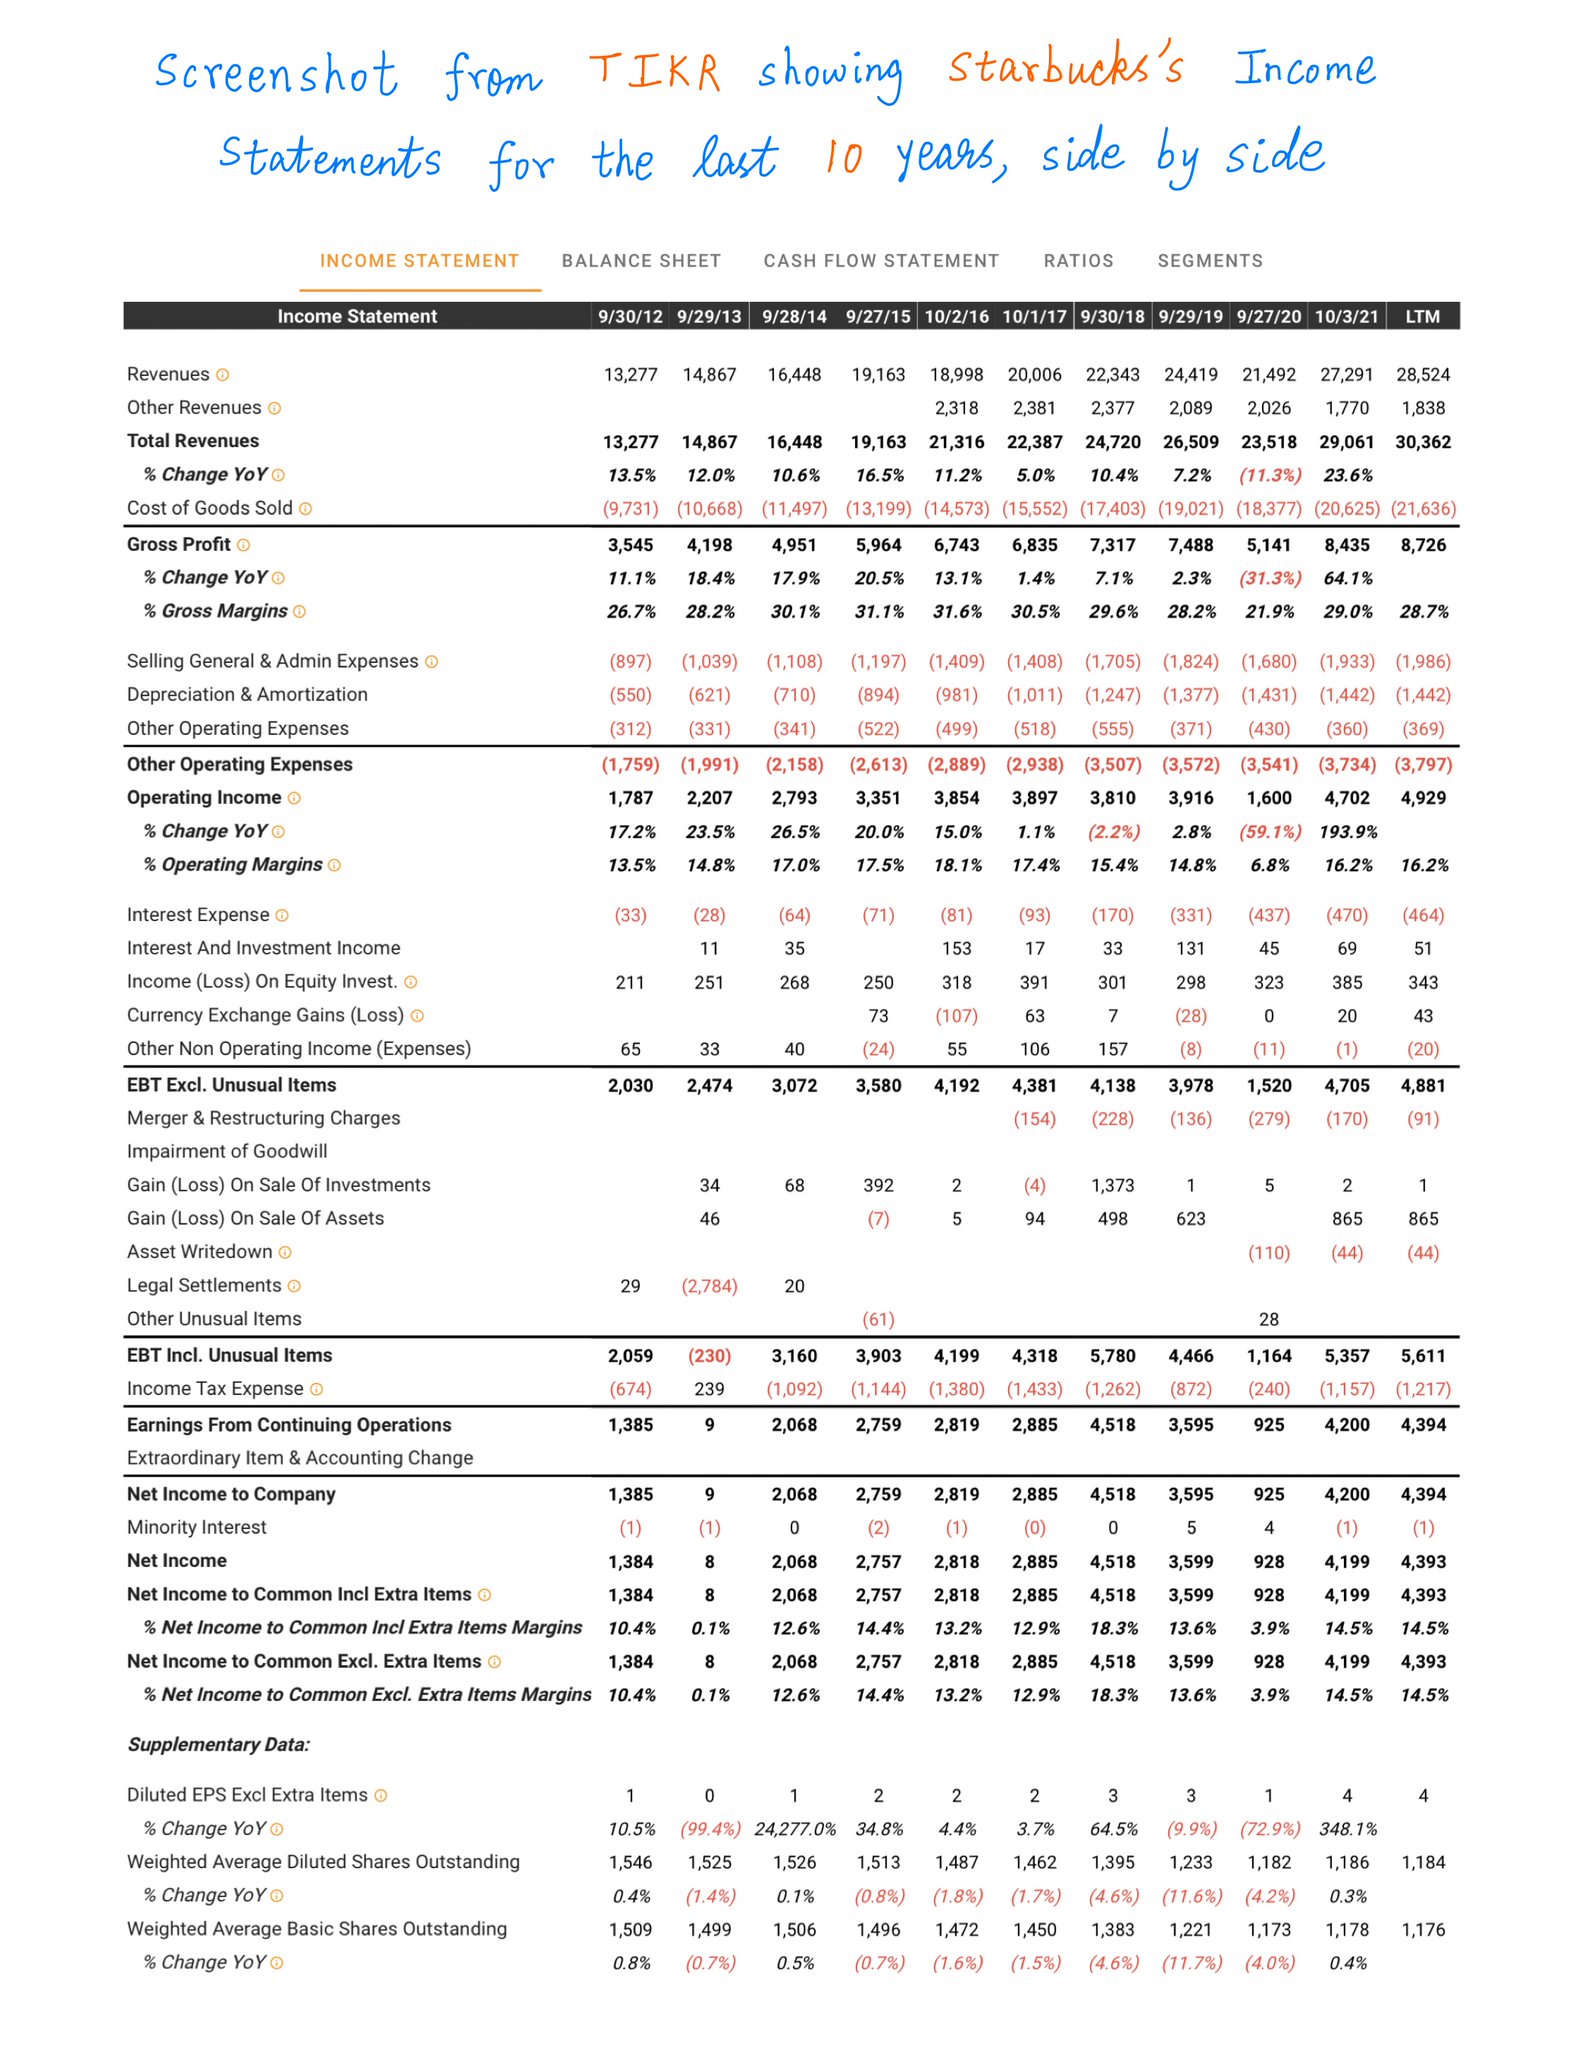
A *single* Income Statement, by itself, can only tell us so much about a business.
To gain MORE insight, we should study SEVERAL Income Statements -- covering *many* consecutive periods -- side by side.
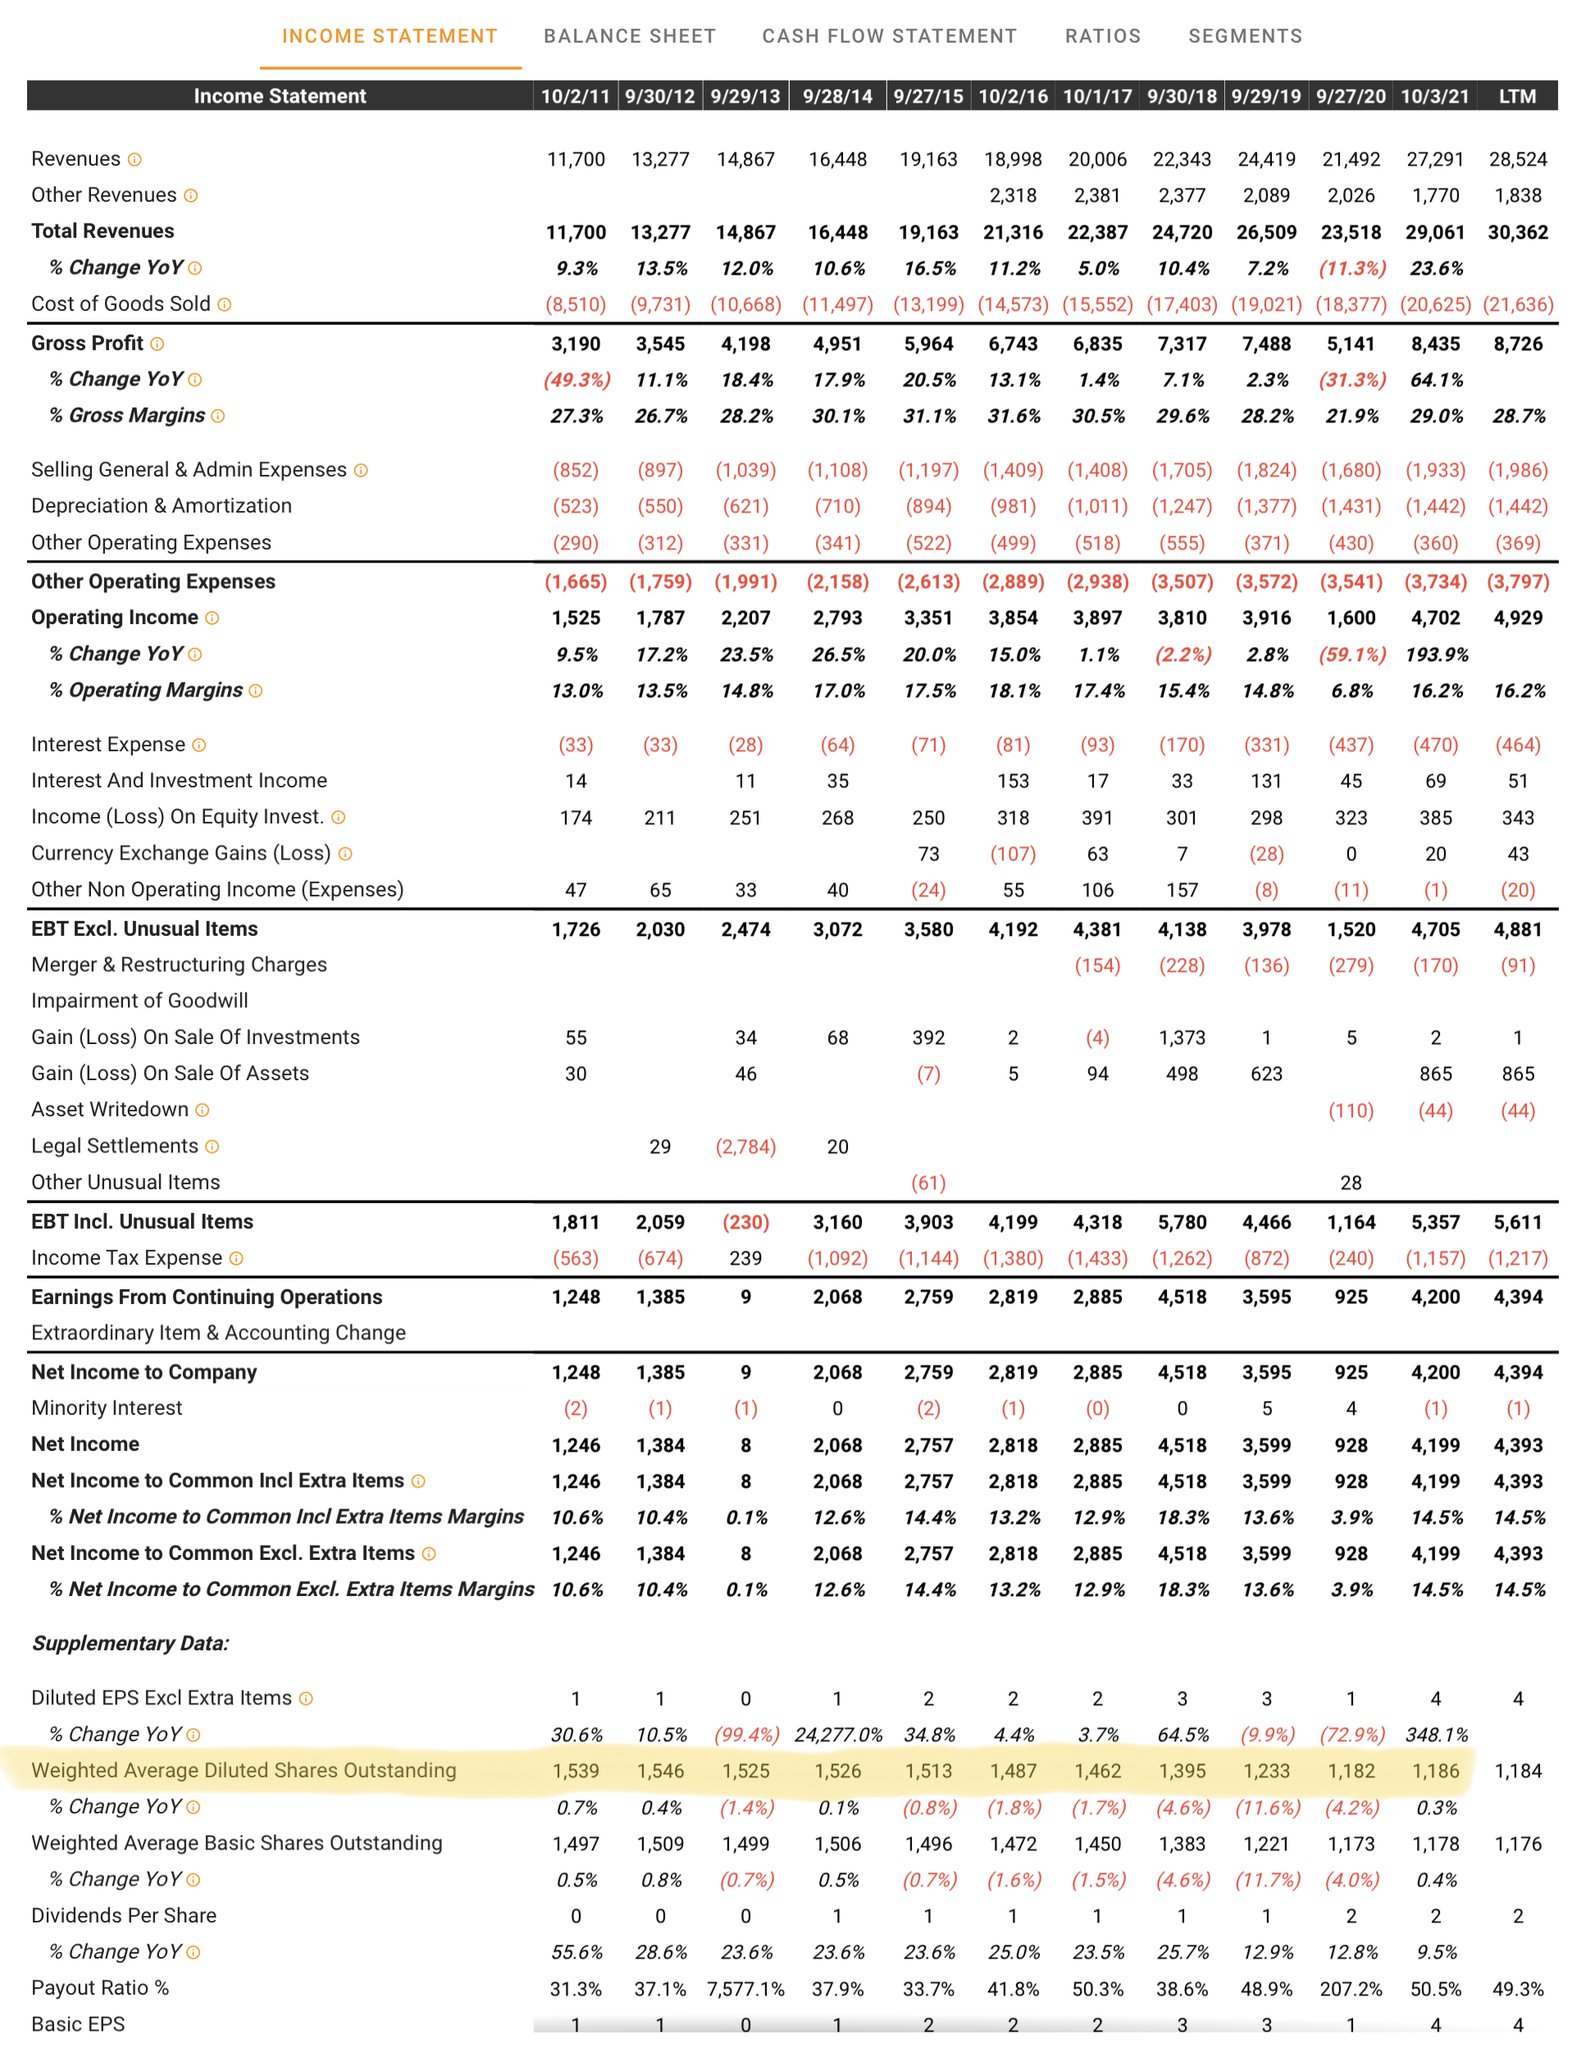
Websites like @theTIKR make this very easy:
A *single* Income Statement, by itself, can only tell us so much about a business.
To gain MORE insight, we should study SEVERAL Income Statements -- covering *many* consecutive periods -- side by side.
Websites like @theTIKR make this very easy:
7/
When I study Income Statements like this, I usually look at 5 Key Metrics -- to help me identify good companies to invest in.
I'm now going to share these metrics with you. You may find them useful for your own research.
When I study Income Statements like this, I usually look at 5 Key Metrics -- to help me identify good companies to invest in.
I'm now going to share these metrics with you. You may find them useful for your own research.
8/
Key Metric #1: Sales Growth
"Melting ice cubes" are not for me. When I invest in a company, I like to see top line growth.
But I don't need growth on steroids.
A company that can grow revenues at 5% to 10% per year can deliver great returns under the right circumstances.
Key Metric #1: Sales Growth
"Melting ice cubes" are not for me. When I invest in a company, I like to see top line growth.
But I don't need growth on steroids.
A company that can grow revenues at 5% to 10% per year can deliver great returns under the right circumstances.
9/
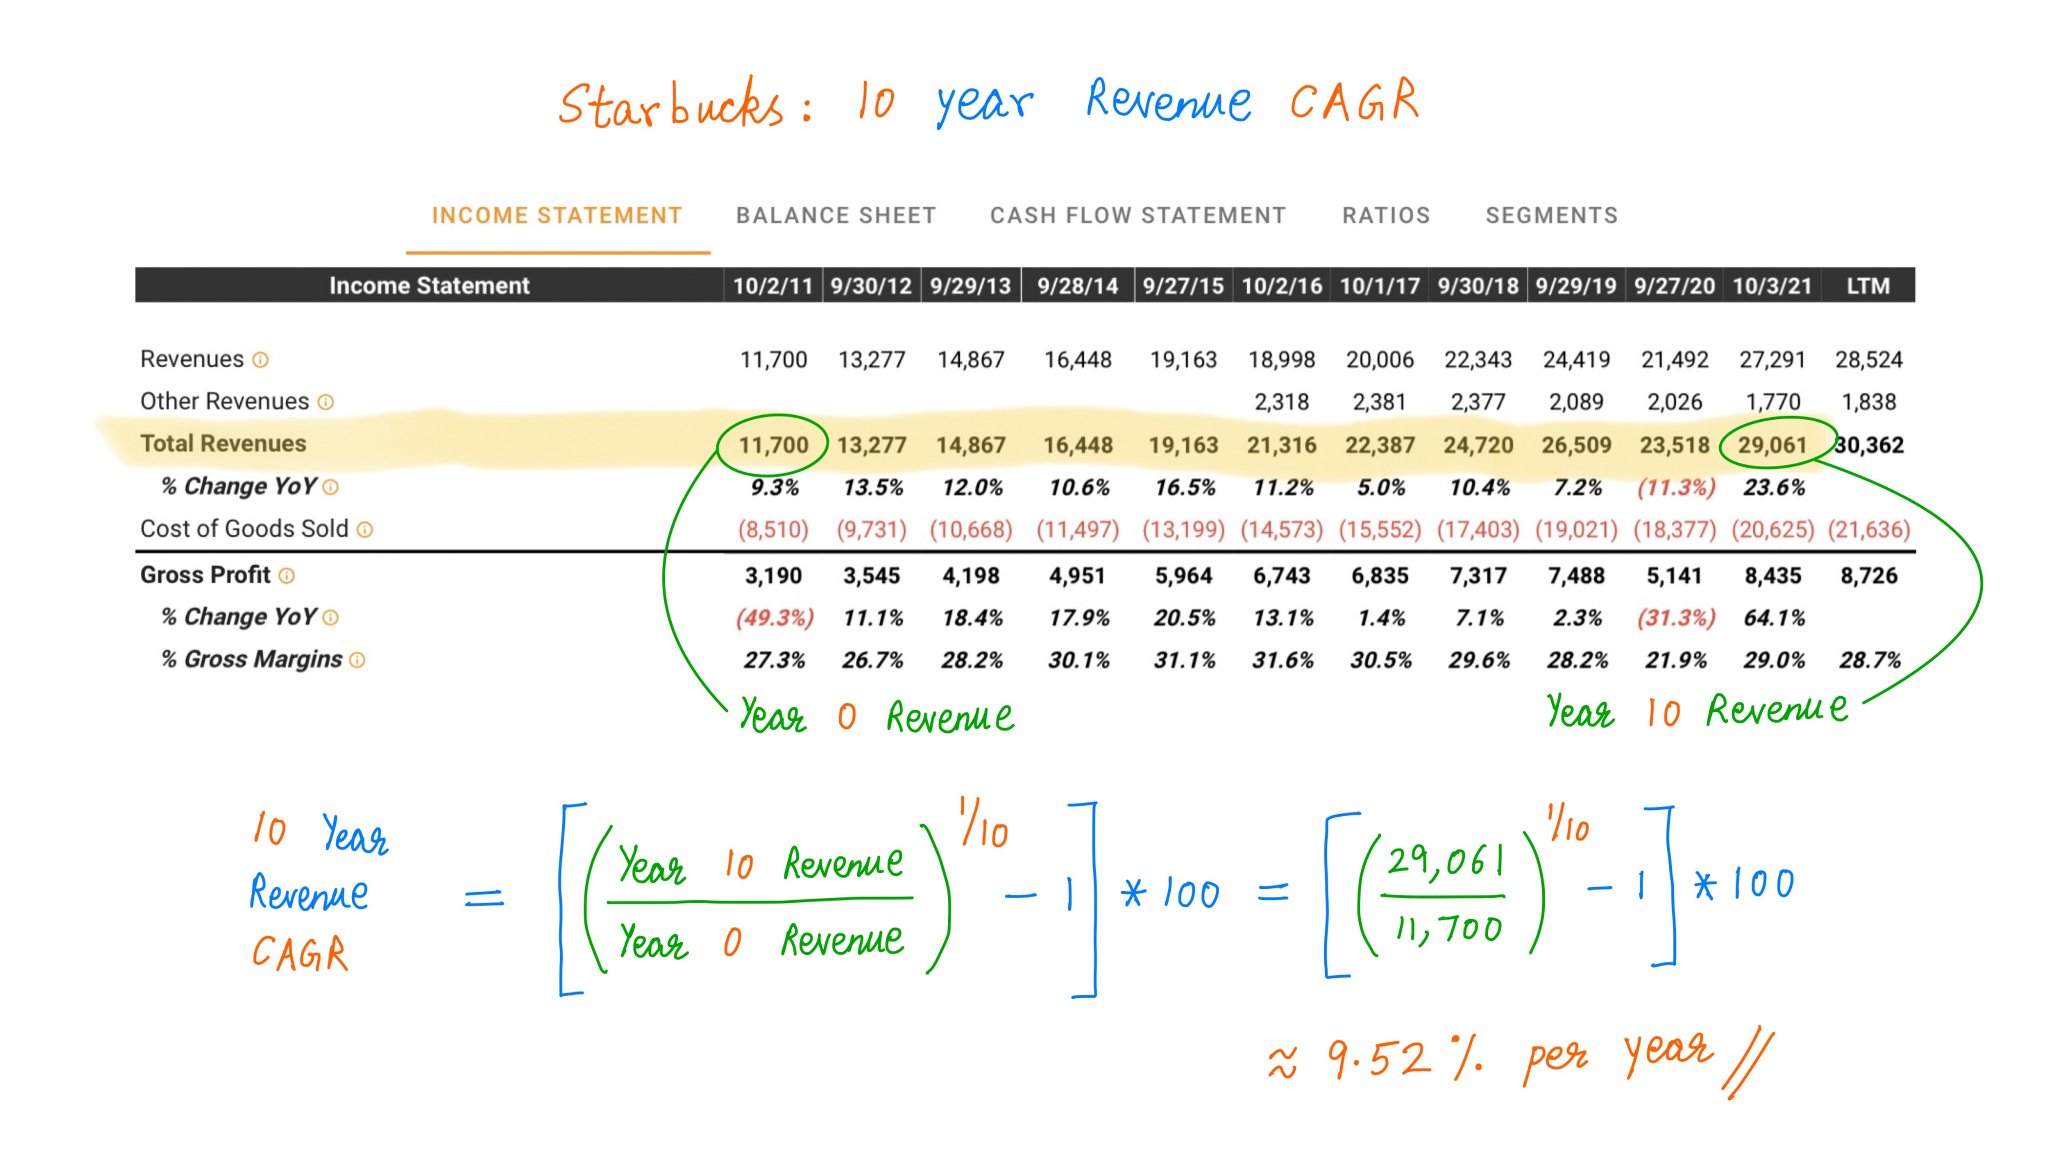
For example, over the last 10 years, we see that Starbucks has grown its top line from ~$11.7B to ~$29.1B.
That's a 10-year CAGR of ~9.52% -- not bad.
For example, over the last 10 years, we see that Starbucks has grown its top line from ~$11.7B to ~$29.1B.
That's a 10-year CAGR of ~9.52% -- not bad.
10/
But there's a caveat: NOT all growth is "good".
In particular, *growth* adds *value* ONLY if it is accompanied by good returns on capital.
In other words, if growth takes up too much capital, it can end up *destroying* value for owners.
For more:
But there's a caveat: NOT all growth is "good".
In particular, *growth* adds *value* ONLY if it is accompanied by good returns on capital.
In other words, if growth takes up too much capital, it can end up *destroying* value for owners.
For more:
11/
Key Metric #2: Steady Gross Margins
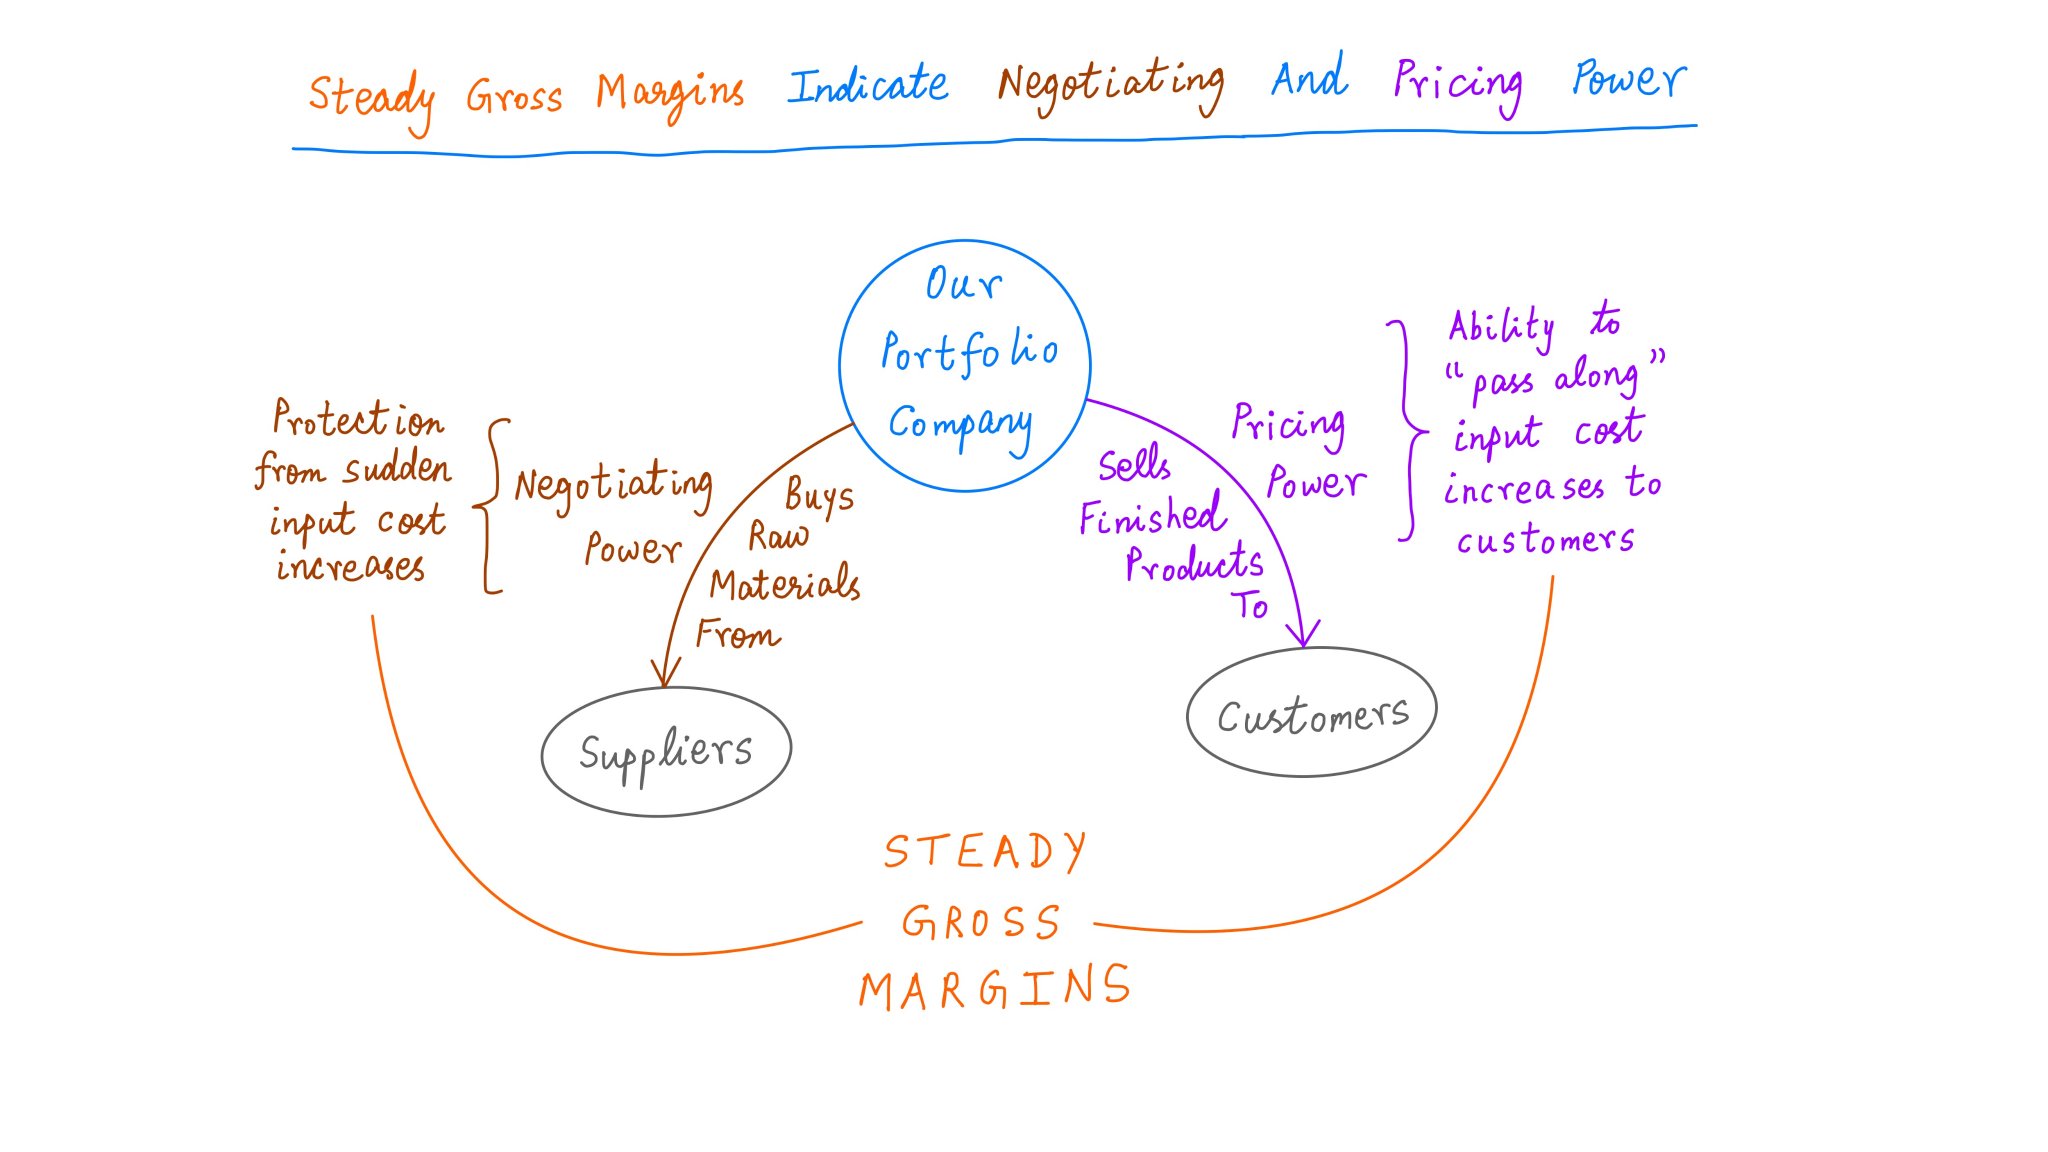
Companies typically buy raw materials from suppliers and sell finished products to customers.
So, our portfolio companies should have BOTH strong *Negotiating Power* with suppliers and strong *Pricing Power* with customers.
Key Metric #2: Steady Gross Margins
Companies typically buy raw materials from suppliers and sell finished products to customers.
So, our portfolio companies should have BOTH strong *Negotiating Power* with suppliers and strong *Pricing Power* with customers.
12/
Companies that have BOTH these powers are usually able to maintain Steady Gross Margins -- or even *grow* their Gross Margins -- over time.
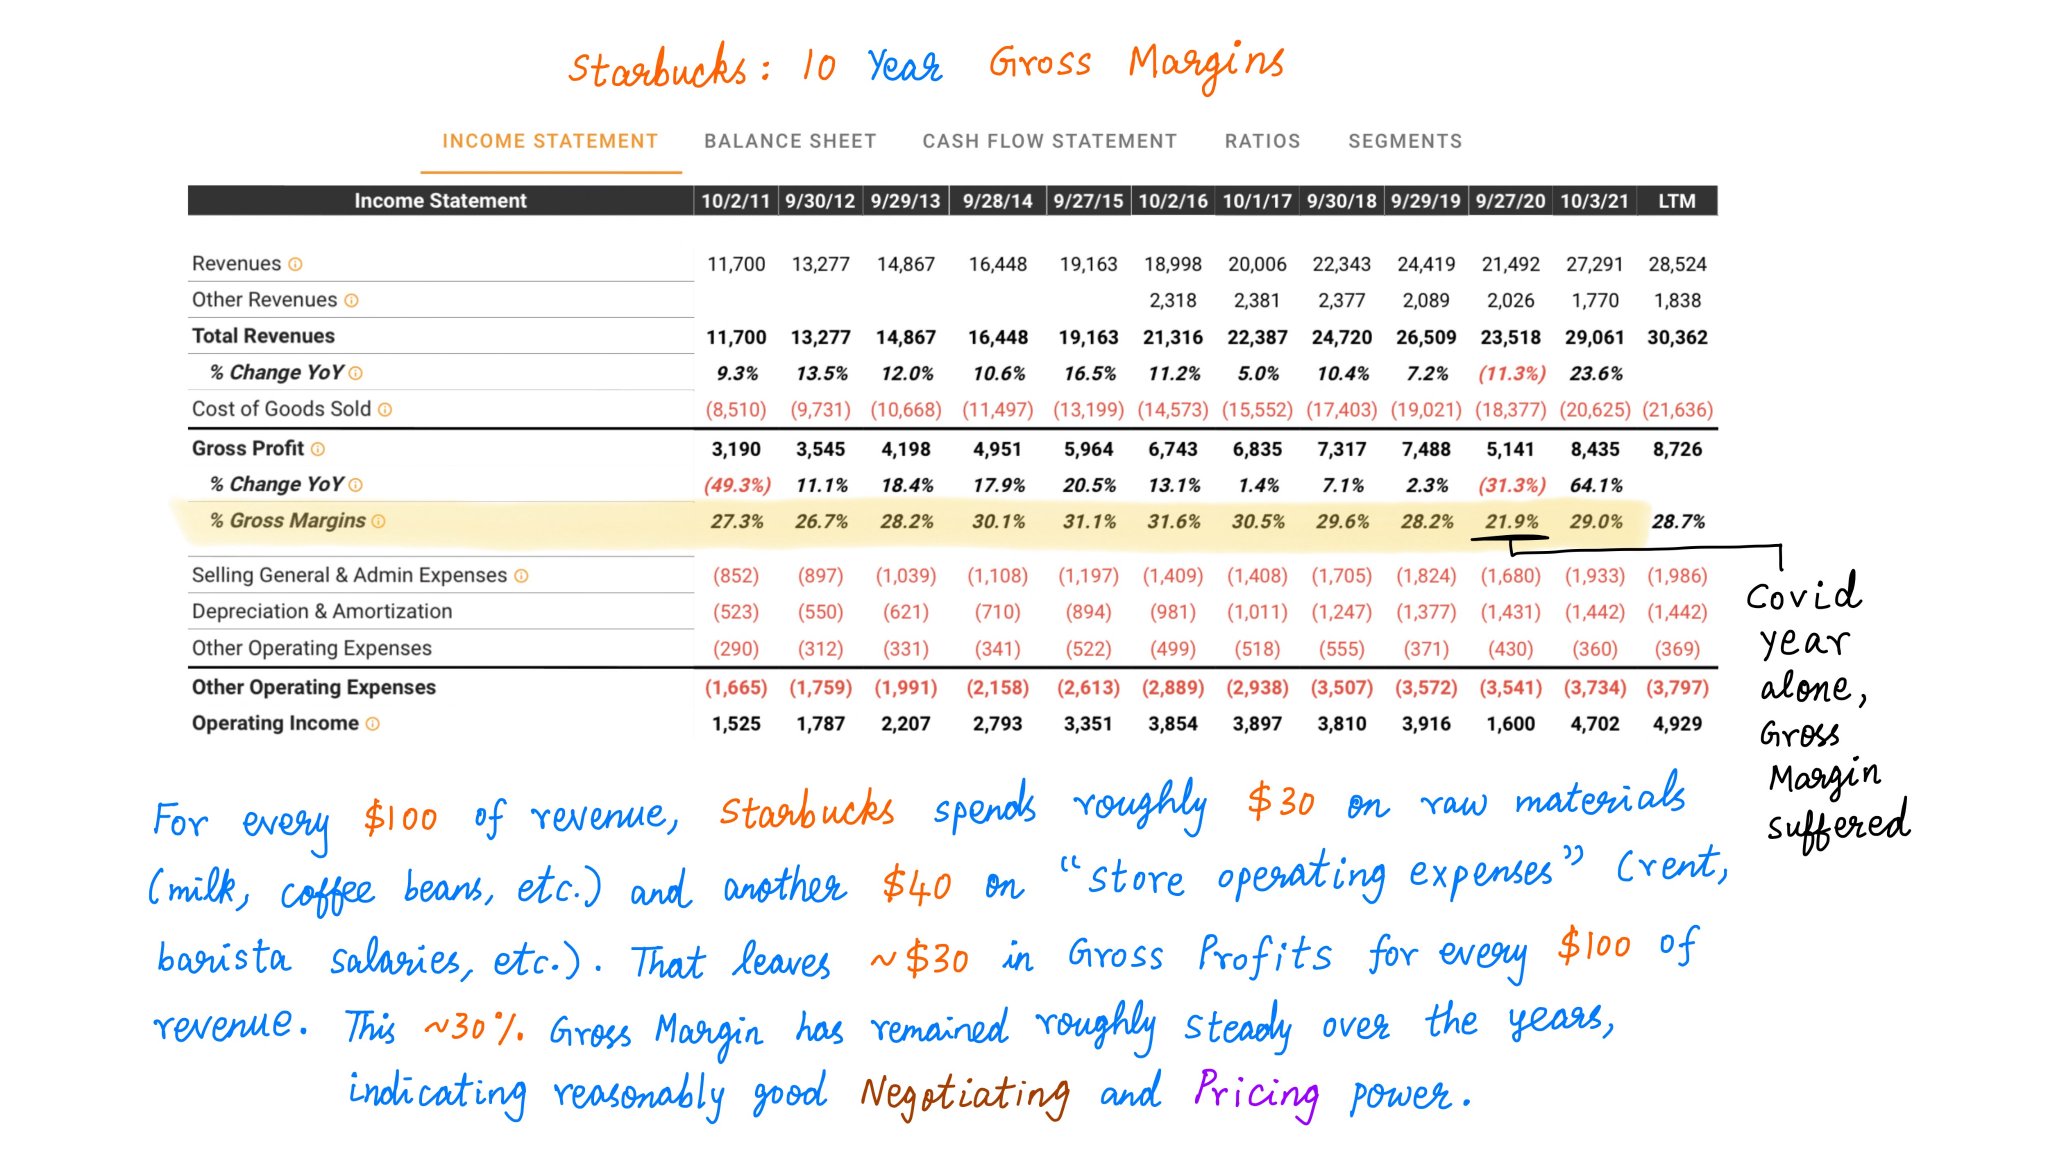
For example, over the last 10 years, we see that Starbucks's Gross Margins have remained fairly steady at around 30%:
Companies that have BOTH these powers are usually able to maintain Steady Gross Margins -- or even *grow* their Gross Margins -- over time.
For example, over the last 10 years, we see that Starbucks's Gross Margins have remained fairly steady at around 30%:
13/
Key Metric #3: Operating Leverage
"Operating Leverage" means *profits* can grow FASTER than *revenues*.
That is, for every $1 of "top line" growth, more and more of that $1 can flow directly through to the "bottom line".
This can be a very agreeable dynamic.
Key Metric #3: Operating Leverage
"Operating Leverage" means *profits* can grow FASTER than *revenues*.
That is, for every $1 of "top line" growth, more and more of that $1 can flow directly through to the "bottom line".
This can be a very agreeable dynamic.
14/
Typically, this occurs when a meaningful portion of a company's costs are *fixed* -- and don't grow with revenues.
So, when revenues grow, costs don't grow as fast. Therefore, *profits* grow even faster.
Here's an animation that @BrianFeroldi and I made to illustrate this:
Typically, this occurs when a meaningful portion of a company's costs are *fixed* -- and don't grow with revenues.
So, when revenues grow, costs don't grow as fast. Therefore, *profits* grow even faster.
Here's an animation that @BrianFeroldi and I made to illustrate this:
15/
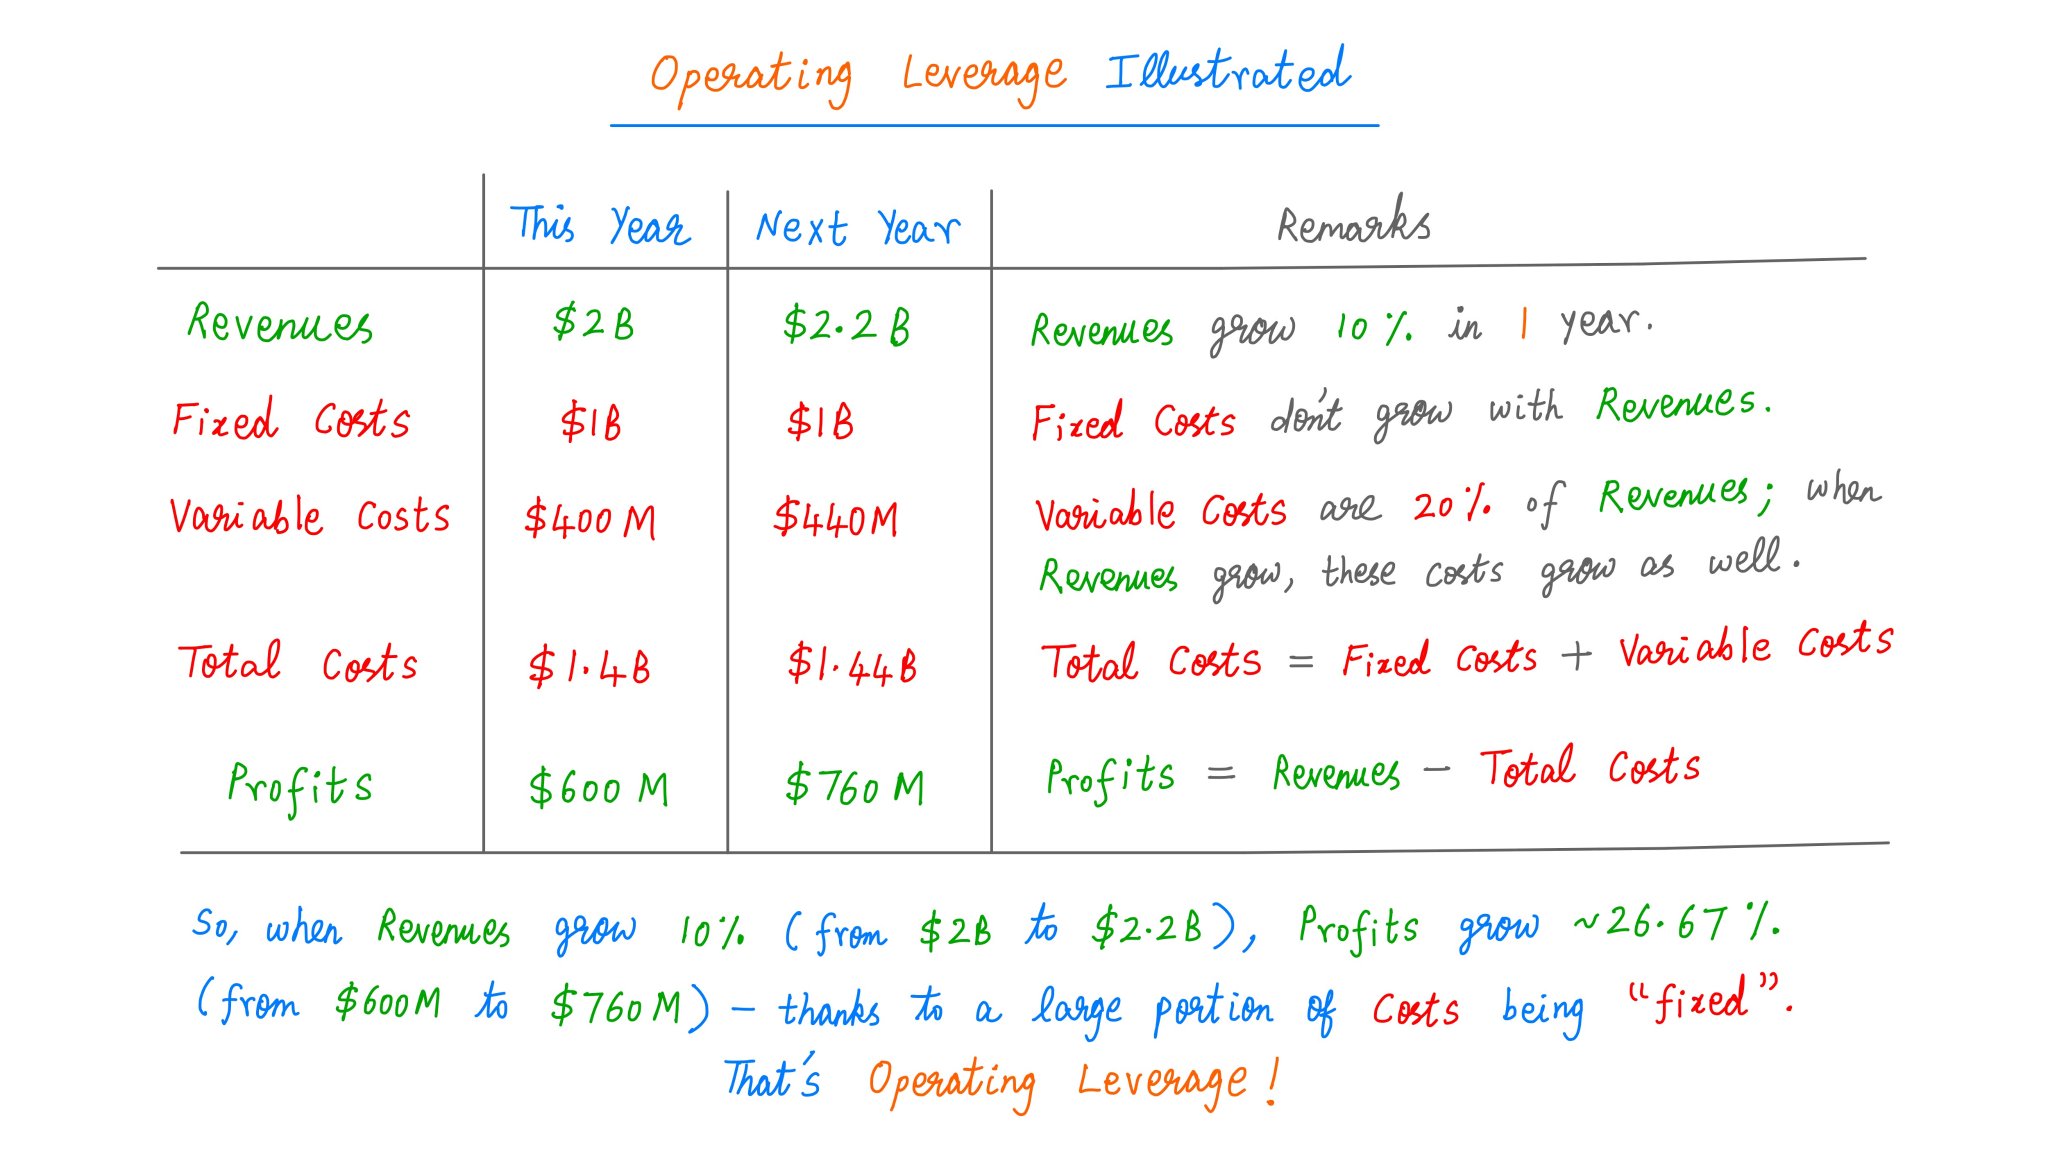
For example, suppose a company has $2B of annual revenues, $1B per year of *fixed* costs, and *variable* costs equal to 20% of revenues.
From this base, if *revenues* grow 10%, *profits* will grow almost 27%.
That's Operating Leverage!
For example, suppose a company has $2B of annual revenues, $1B per year of *fixed* costs, and *variable* costs equal to 20% of revenues.
From this base, if *revenues* grow 10%, *profits* will grow almost 27%.
That's Operating Leverage!
16/
Starbucks doesn't have much Operating Leverage though.
That's because 2 BIG costs for Starbucks (raw materials and store operating expenses) are both closer to *variable* than *fixed* costs.
So, Starbucks's profits have historically grown only a bit faster than revenues:
Starbucks doesn't have much Operating Leverage though.
That's because 2 BIG costs for Starbucks (raw materials and store operating expenses) are both closer to *variable* than *fixed* costs.
So, Starbucks's profits have historically grown only a bit faster than revenues:
17/
There are 2 caveats with Operating Leverage.
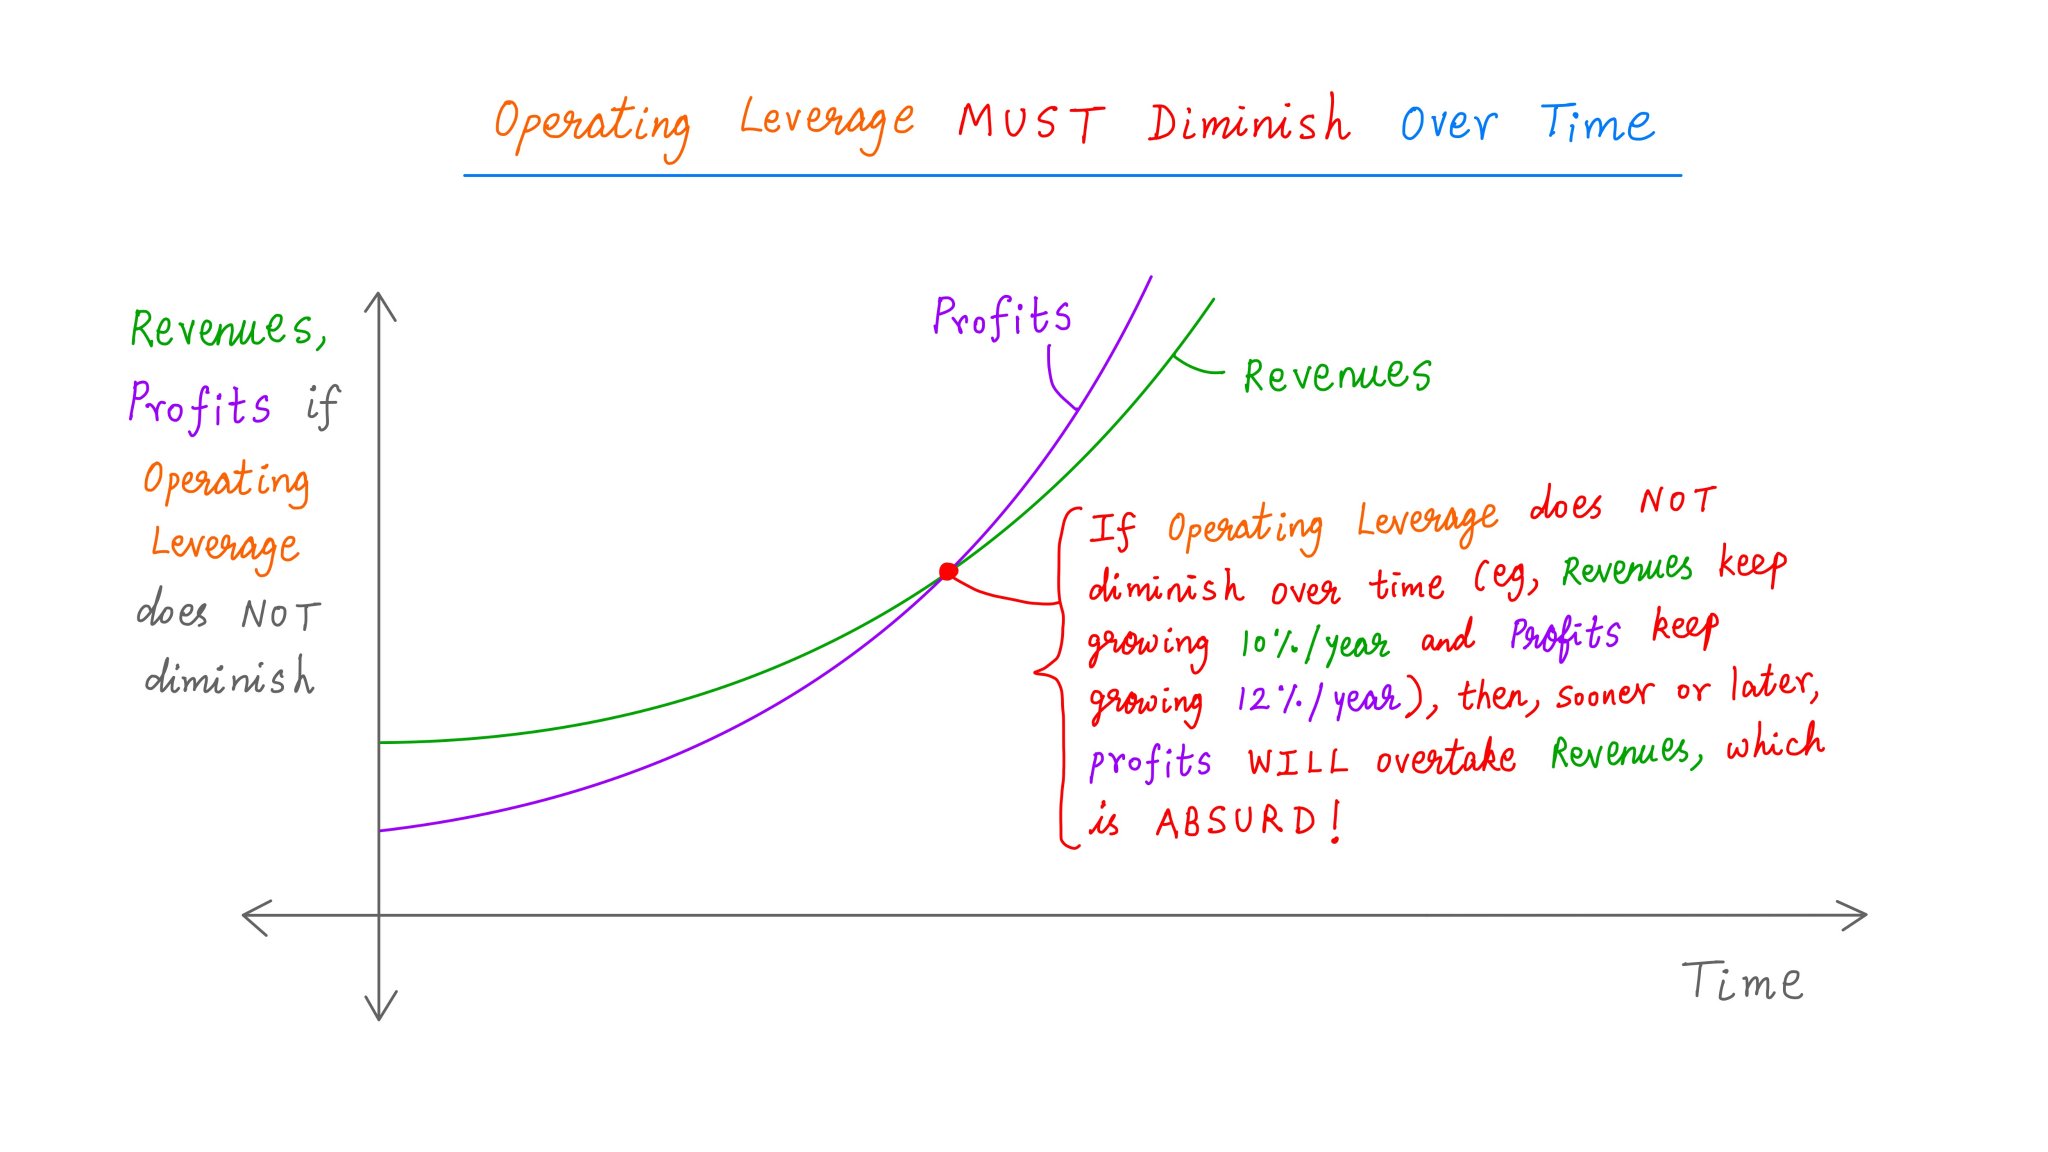
First, it MUST diminish over time.
Profits cannot keep outpacing revenues by the same margin *forever*.
Because, if that happens, profits will eventually *overtake* revenues -- which seems rather unlikely!
There are 2 caveats with Operating Leverage.
First, it MUST diminish over time.
Profits cannot keep outpacing revenues by the same margin *forever*.
Because, if that happens, profits will eventually *overtake* revenues -- which seems rather unlikely!
18/
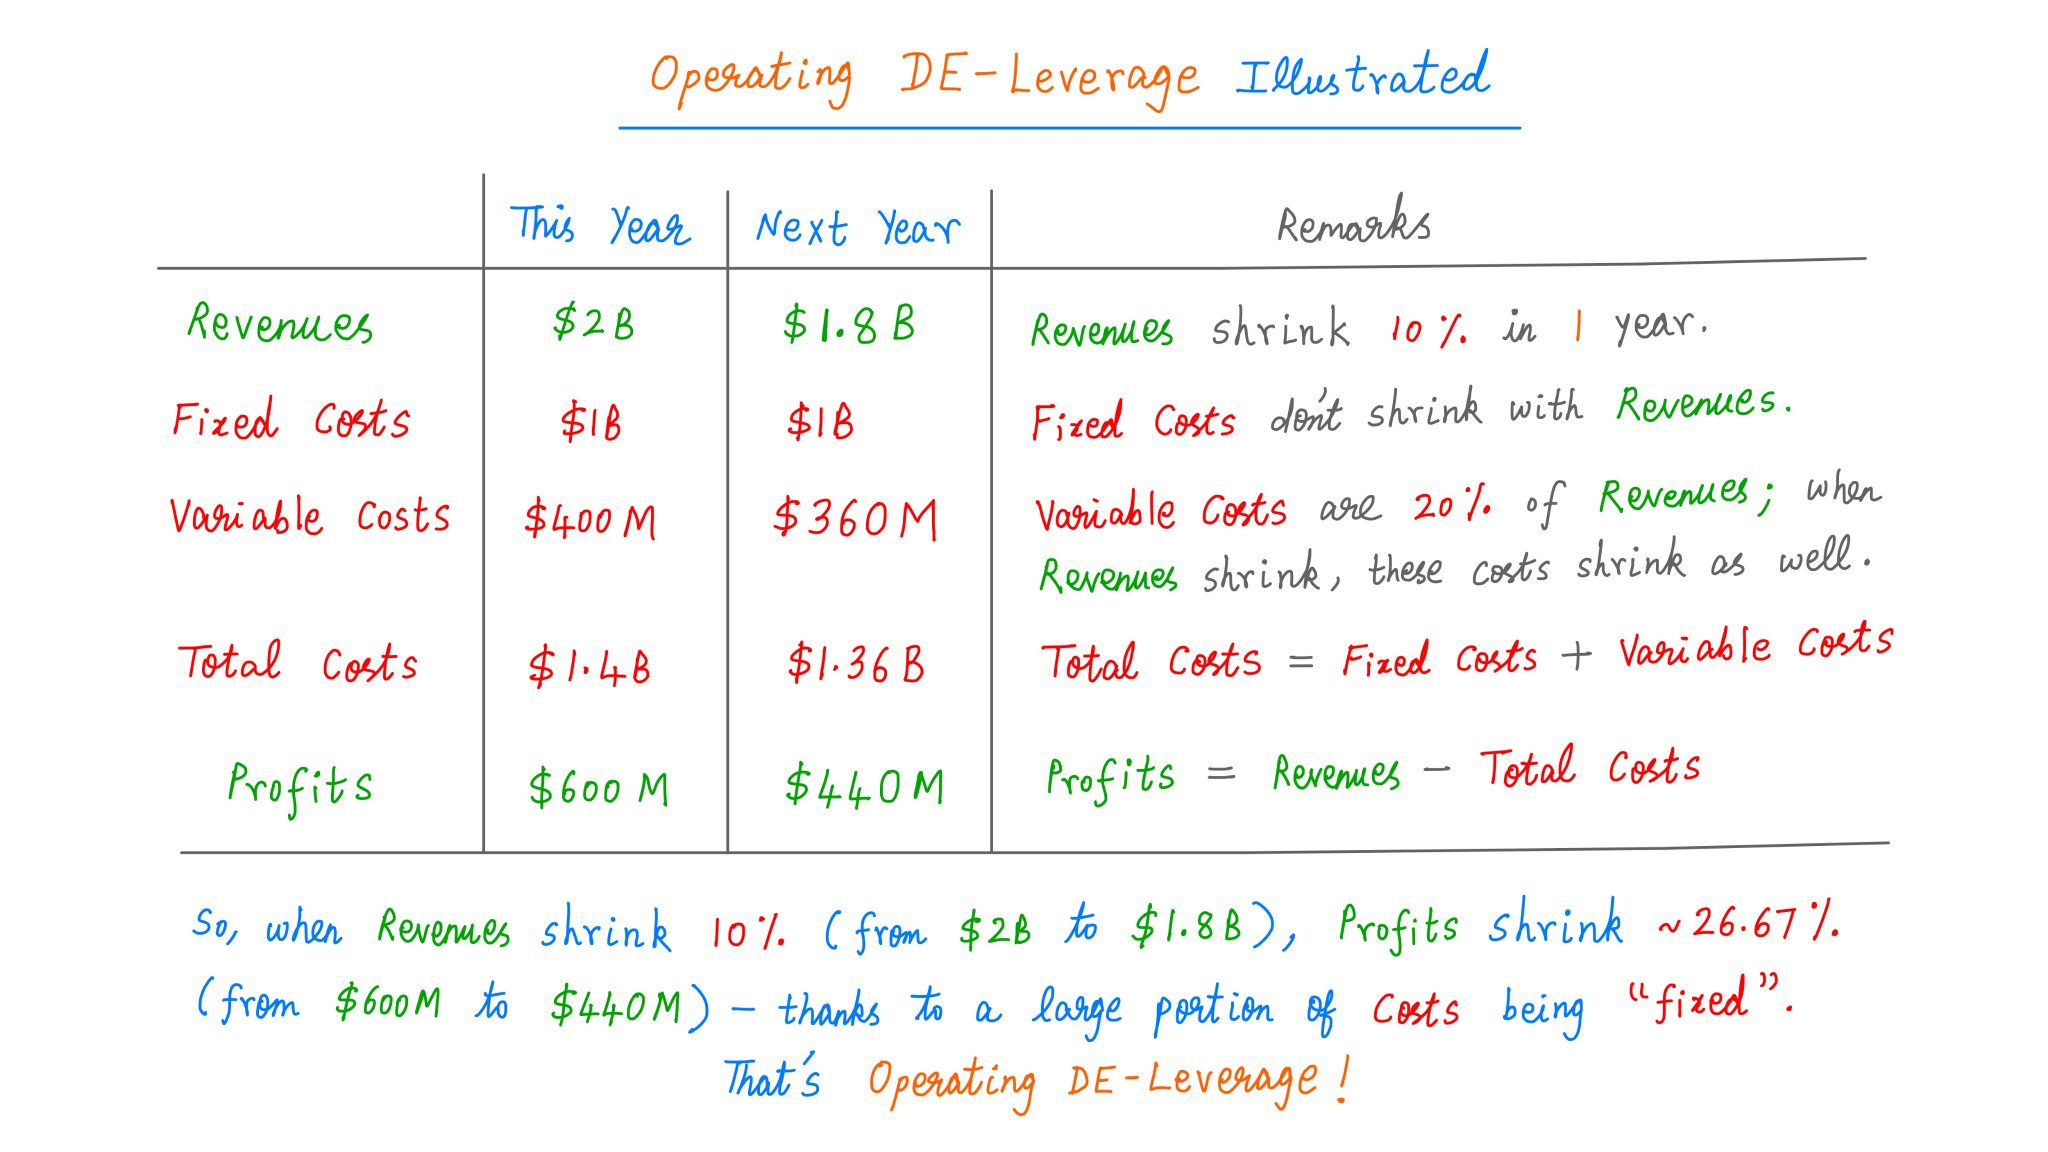
Second, Operating Leverage can work the *other* way too.
IF for some reason revenues *shrink*, profits will shrink even *faster*.
Many companies suffered from this when Covid hit.
It's called Operating *De-Leverage*. And here's how it affects our hypothetical company:
Second, Operating Leverage can work the *other* way too.
IF for some reason revenues *shrink*, profits will shrink even *faster*.
Many companies suffered from this when Covid hit.
It's called Operating *De-Leverage*. And here's how it affects our hypothetical company:
19/
Key Metric #4: Debt Coverage
Income Statements can help us work out whether a company makes enough money to comfortably pay off its debt.
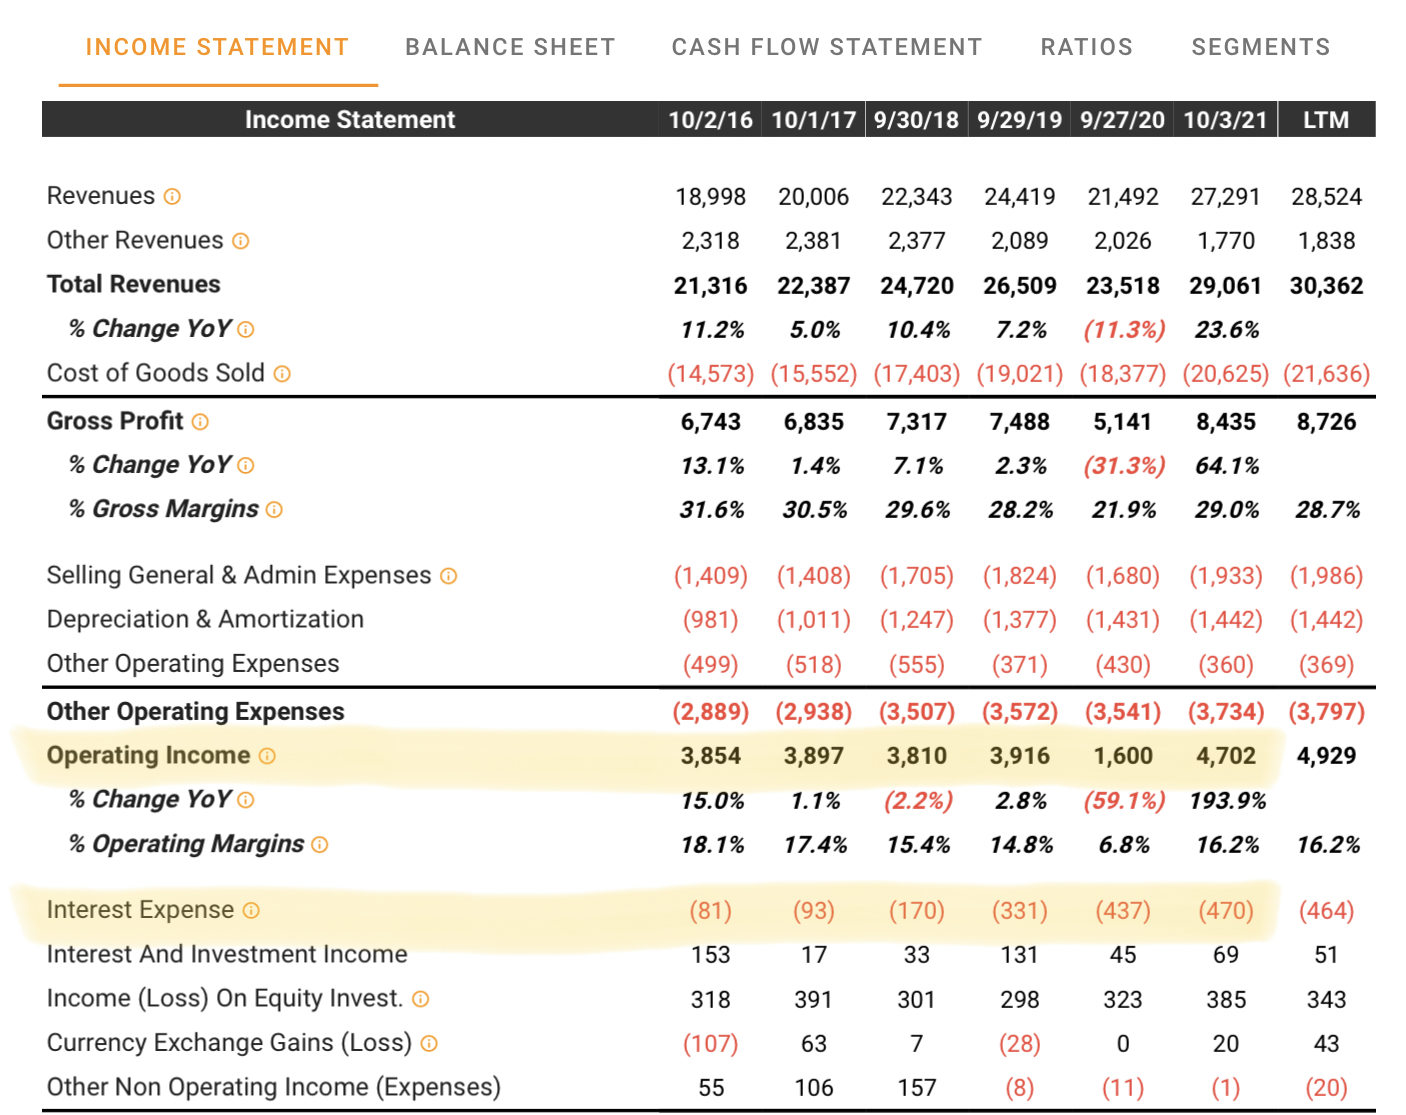
For example, Starbucks made $4.7B of Operating Income in 2021, of which only ~10% ($470M) was Interest Expense. This seems pretty safe.
Key Metric #4: Debt Coverage
Income Statements can help us work out whether a company makes enough money to comfortably pay off its debt.
For example, Starbucks made $4.7B of Operating Income in 2021, of which only ~10% ($470M) was Interest Expense. This seems pretty safe.
20/
But of course, in addition to Interest, debt also comes with *Principal* obligations.
For this, we should study the maturity schedule of the company's debt (from its 10-K).
At a minimum, cash on hand plus Net Income should comfortably cover all near-term maturities.
But of course, in addition to Interest, debt also comes with *Principal* obligations.
For this, we should study the maturity schedule of the company's debt (from its 10-K).
At a minimum, cash on hand plus Net Income should comfortably cover all near-term maturities.
21/
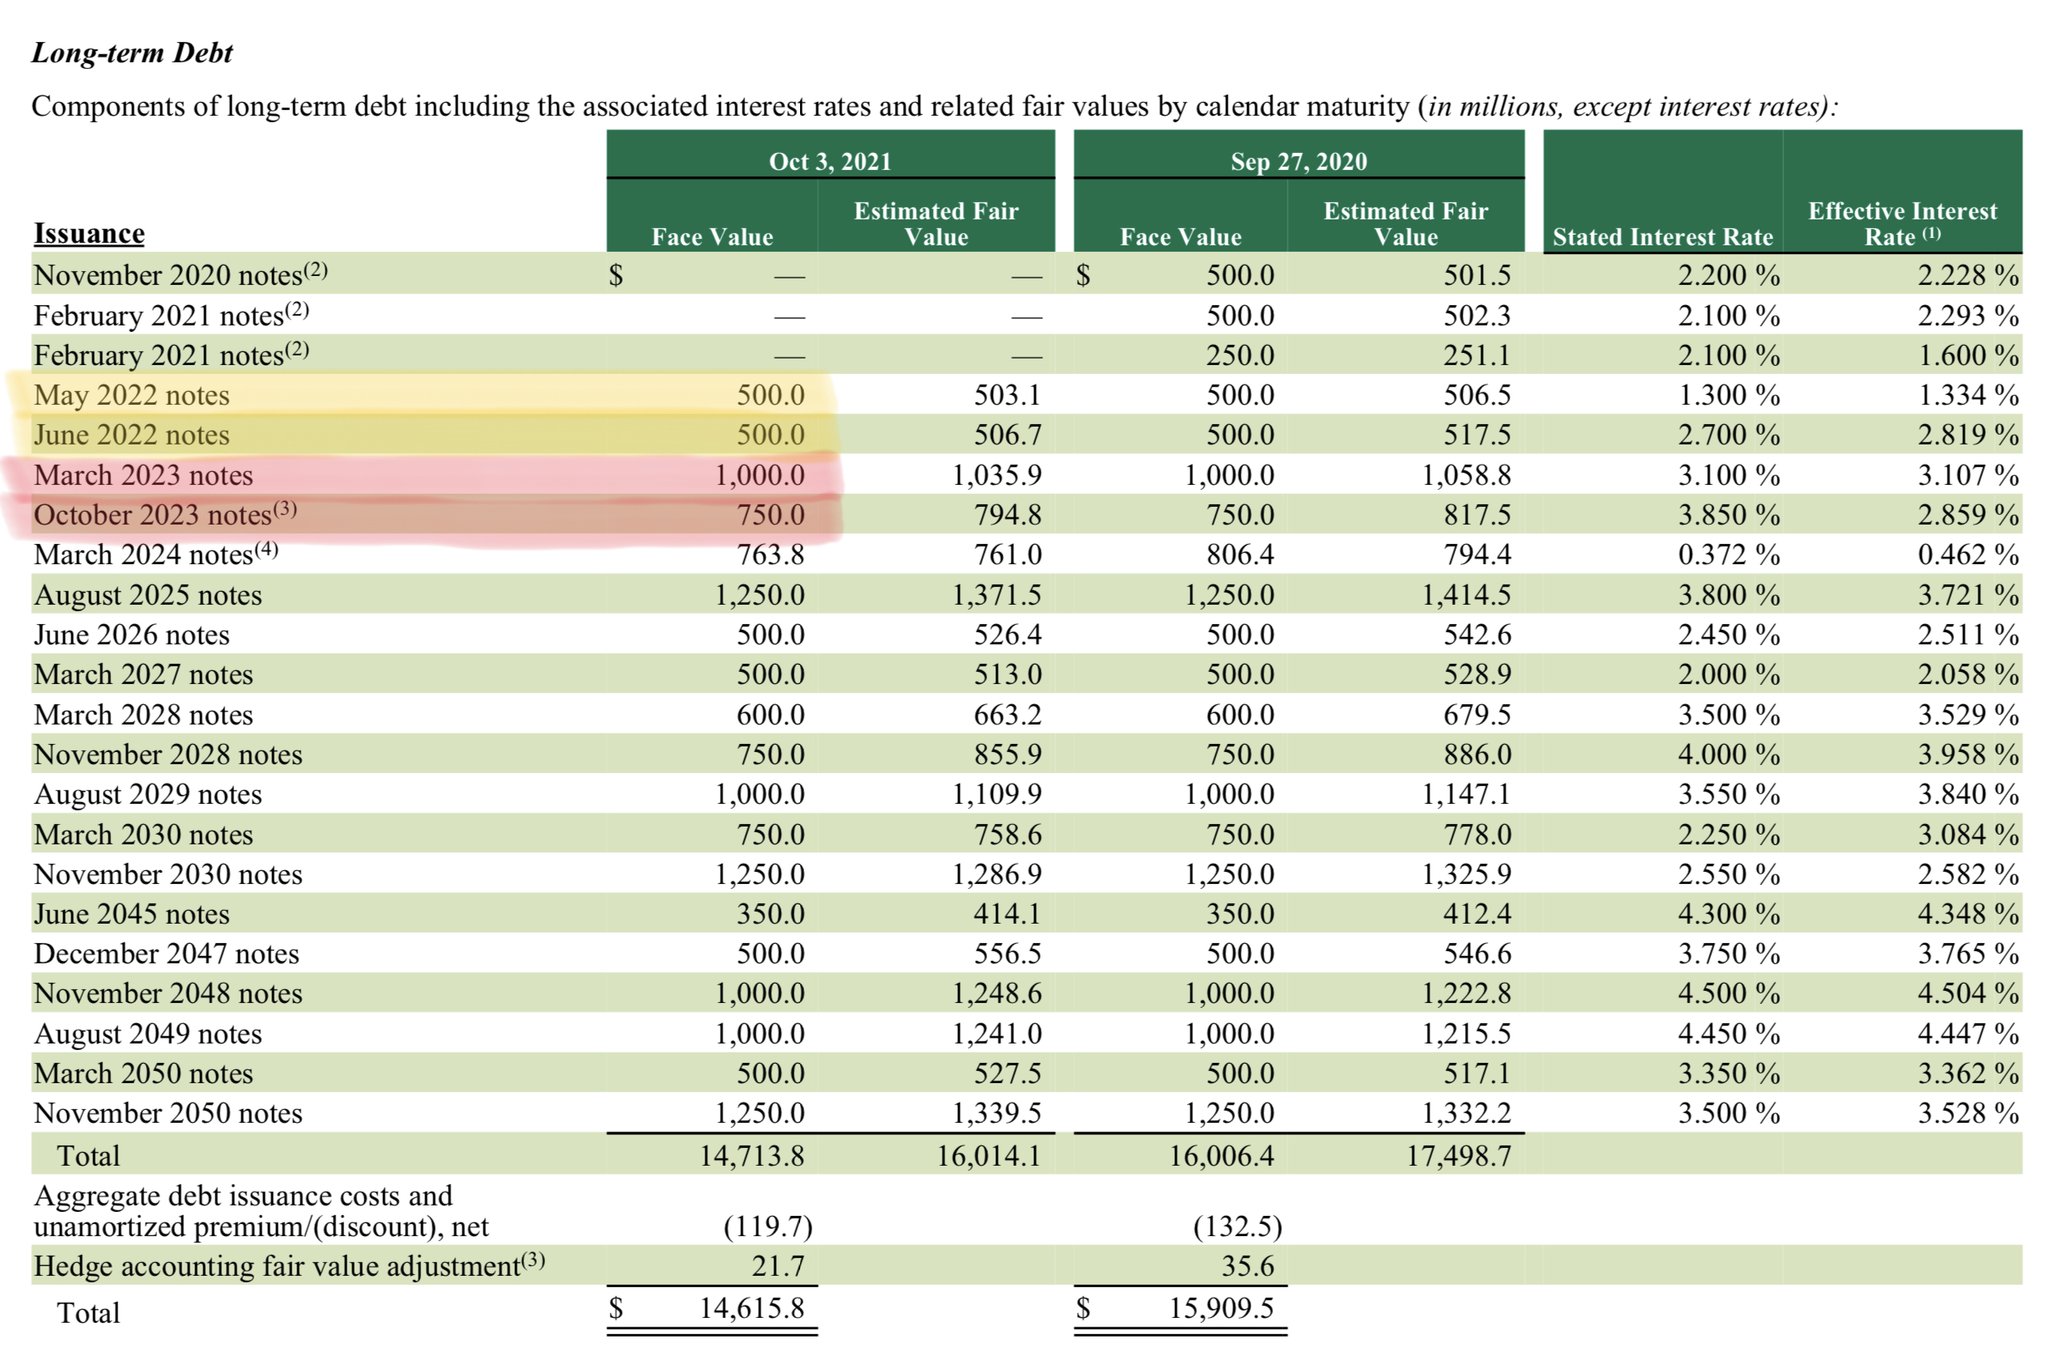
For example, Starbucks's latest 10-K reported $1B of debt coming due in 2022 and $1.75B in 2023.
The company earned $4.2B Net Income in 2021. And they have ~$4B of cash (as of 2022-Jan-02).
So, they seem reasonably well-situated to meet near-term *Principal* obligations.
For example, Starbucks's latest 10-K reported $1B of debt coming due in 2022 and $1.75B in 2023.
The company earned $4.2B Net Income in 2021. And they have ~$4B of cash (as of 2022-Jan-02).
So, they seem reasonably well-situated to meet near-term *Principal* obligations.
22/
One caveat here: *Profits* are NOT *Cash Flows*.
Just because a company reports $1 of Net Income, it does NOT mean the company has an extra $1 of Cash to pay off debt, distribute to owners, etc.
That's why we study Cash Flow Statements.
For more:
One caveat here: *Profits* are NOT *Cash Flows*.
Just because a company reports $1 of Net Income, it does NOT mean the company has an extra $1 of Cash to pay off debt, distribute to owners, etc.
That's why we study Cash Flow Statements.
For more:
23/
Key Metric #5: Dilution
Companies often issue shares and give them to employees as Stock Based Compensation (SBC).
This *dilutes* existing shareholders.
The "Share Counts" reported in Income Statements can tell us whether this dilution is manageable or excessive.
Key Metric #5: Dilution
Companies often issue shares and give them to employees as Stock Based Compensation (SBC).
This *dilutes* existing shareholders.
The "Share Counts" reported in Income Statements can tell us whether this dilution is manageable or excessive.
24/
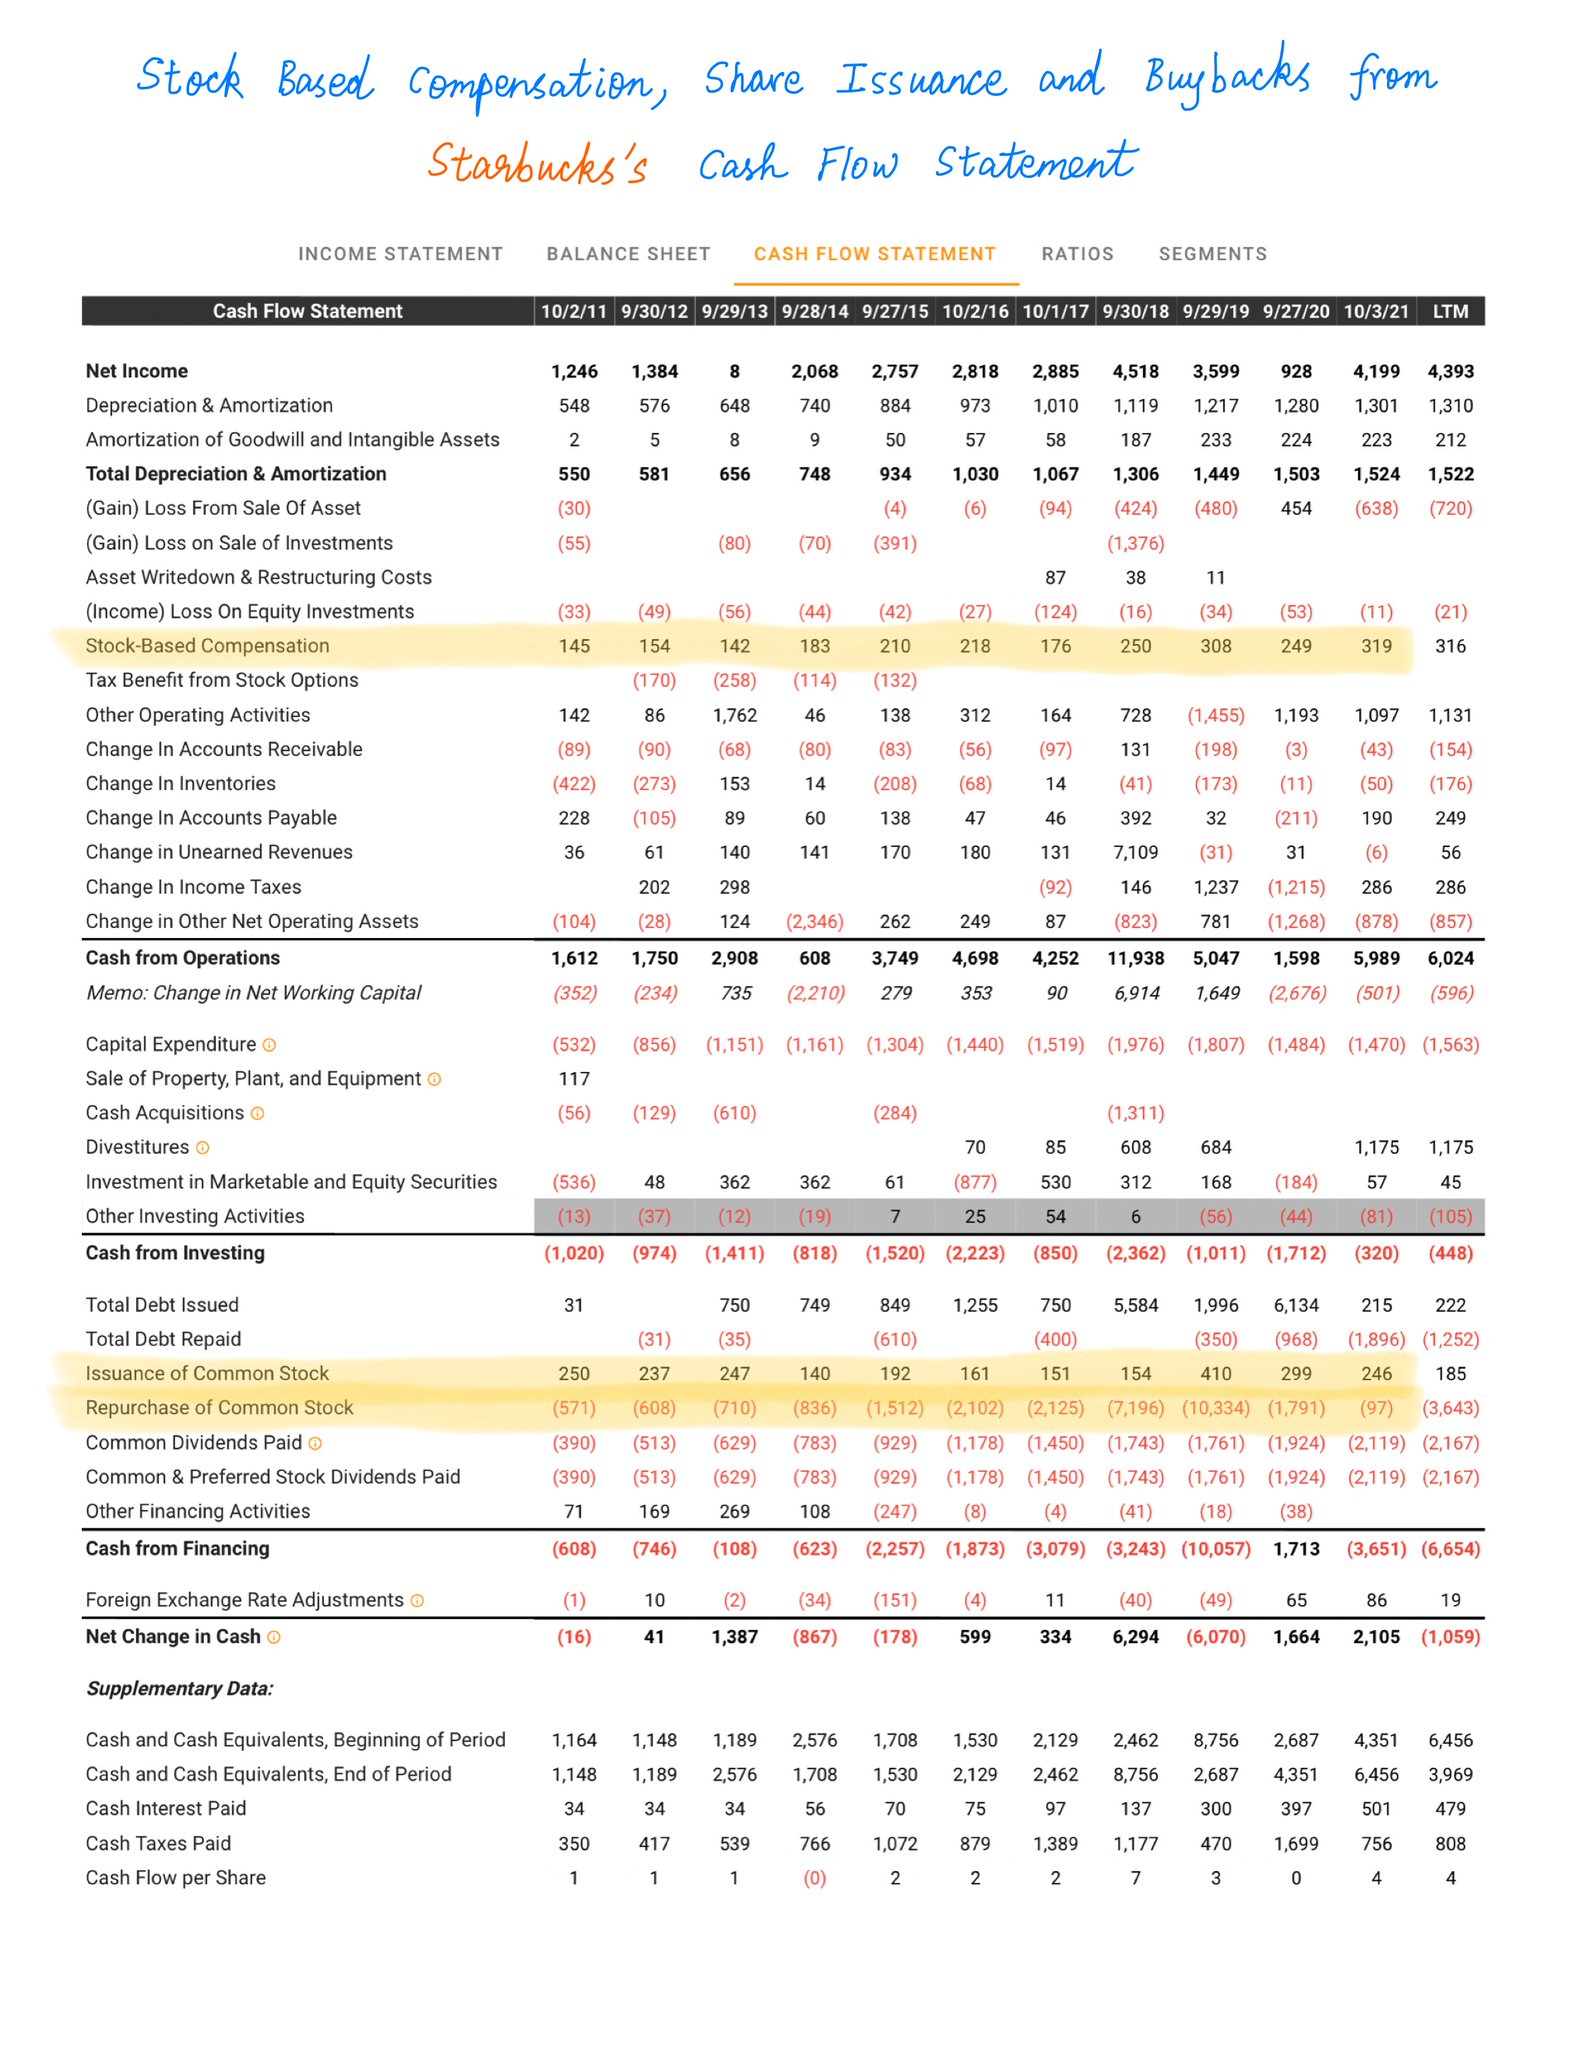
For example, Starbucks's "Share Count" has actually been *decreasing* over time -- because Starbucks has been *buying back* shares.
But it's hard to tell how much of the buybacks went to actually *retiring* shares, and how much went to just *offsetting dilution* due to SBC.
For example, Starbucks's "Share Count" has actually been *decreasing* over time -- because Starbucks has been *buying back* shares.
But it's hard to tell how much of the buybacks went to actually *retiring* shares, and how much went to just *offsetting dilution* due to SBC.
25/
So, we study the SBC and Share Issuance/Buybacks lines on the Cash Flow Statement.
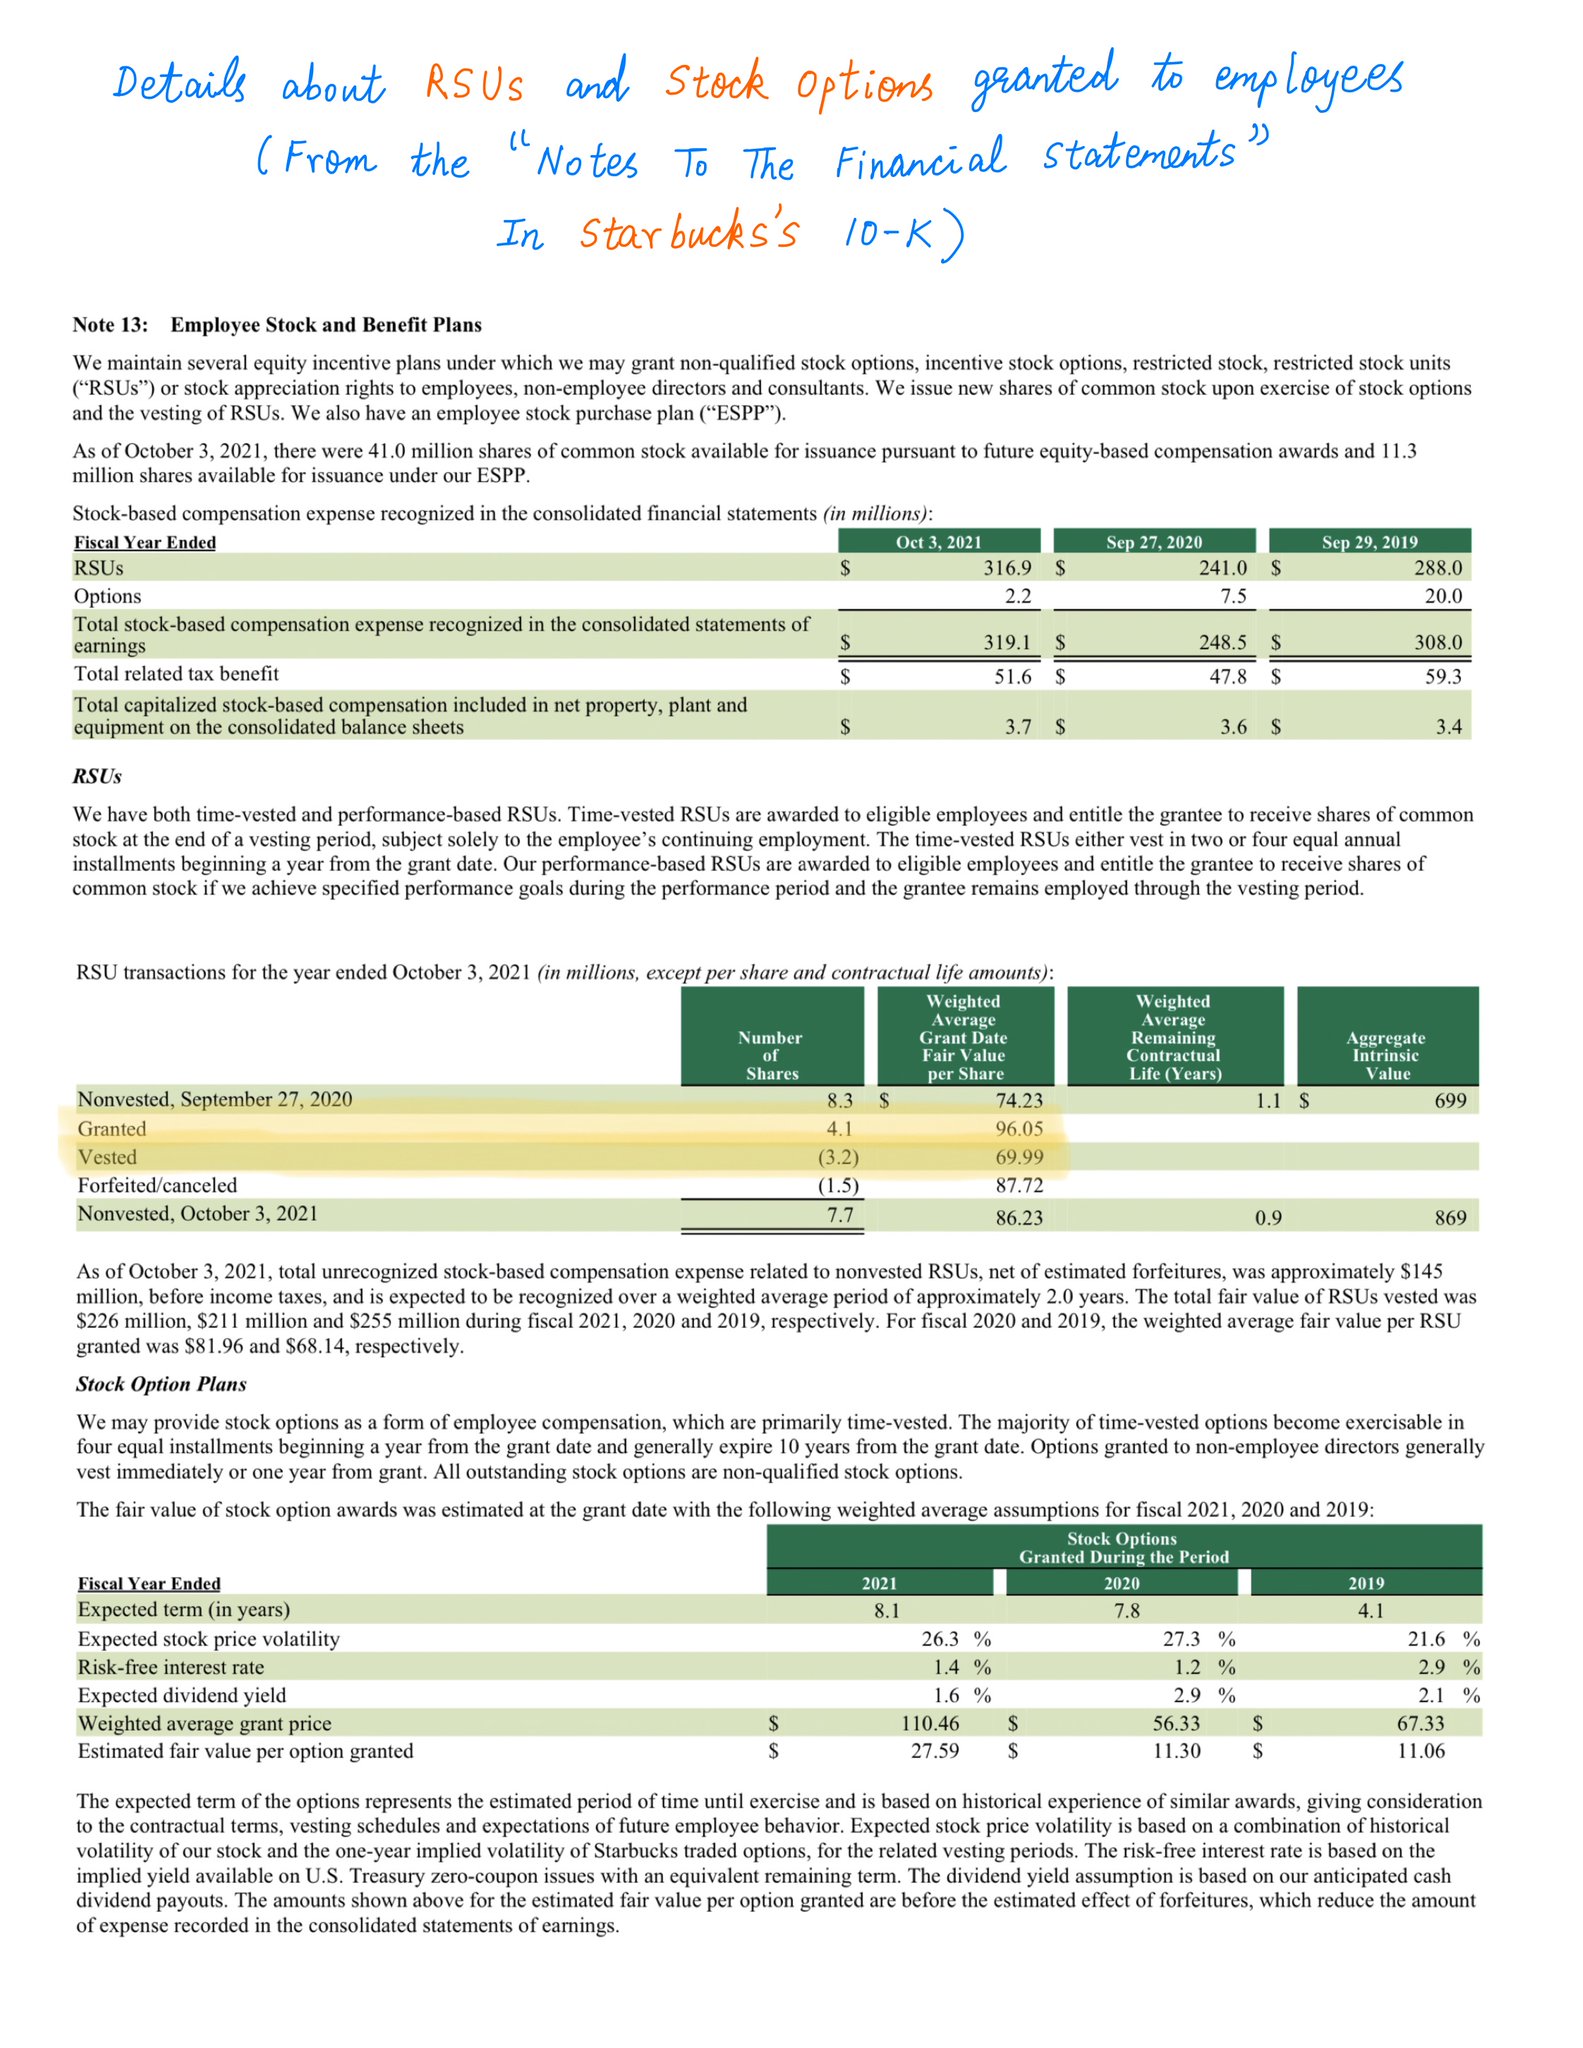
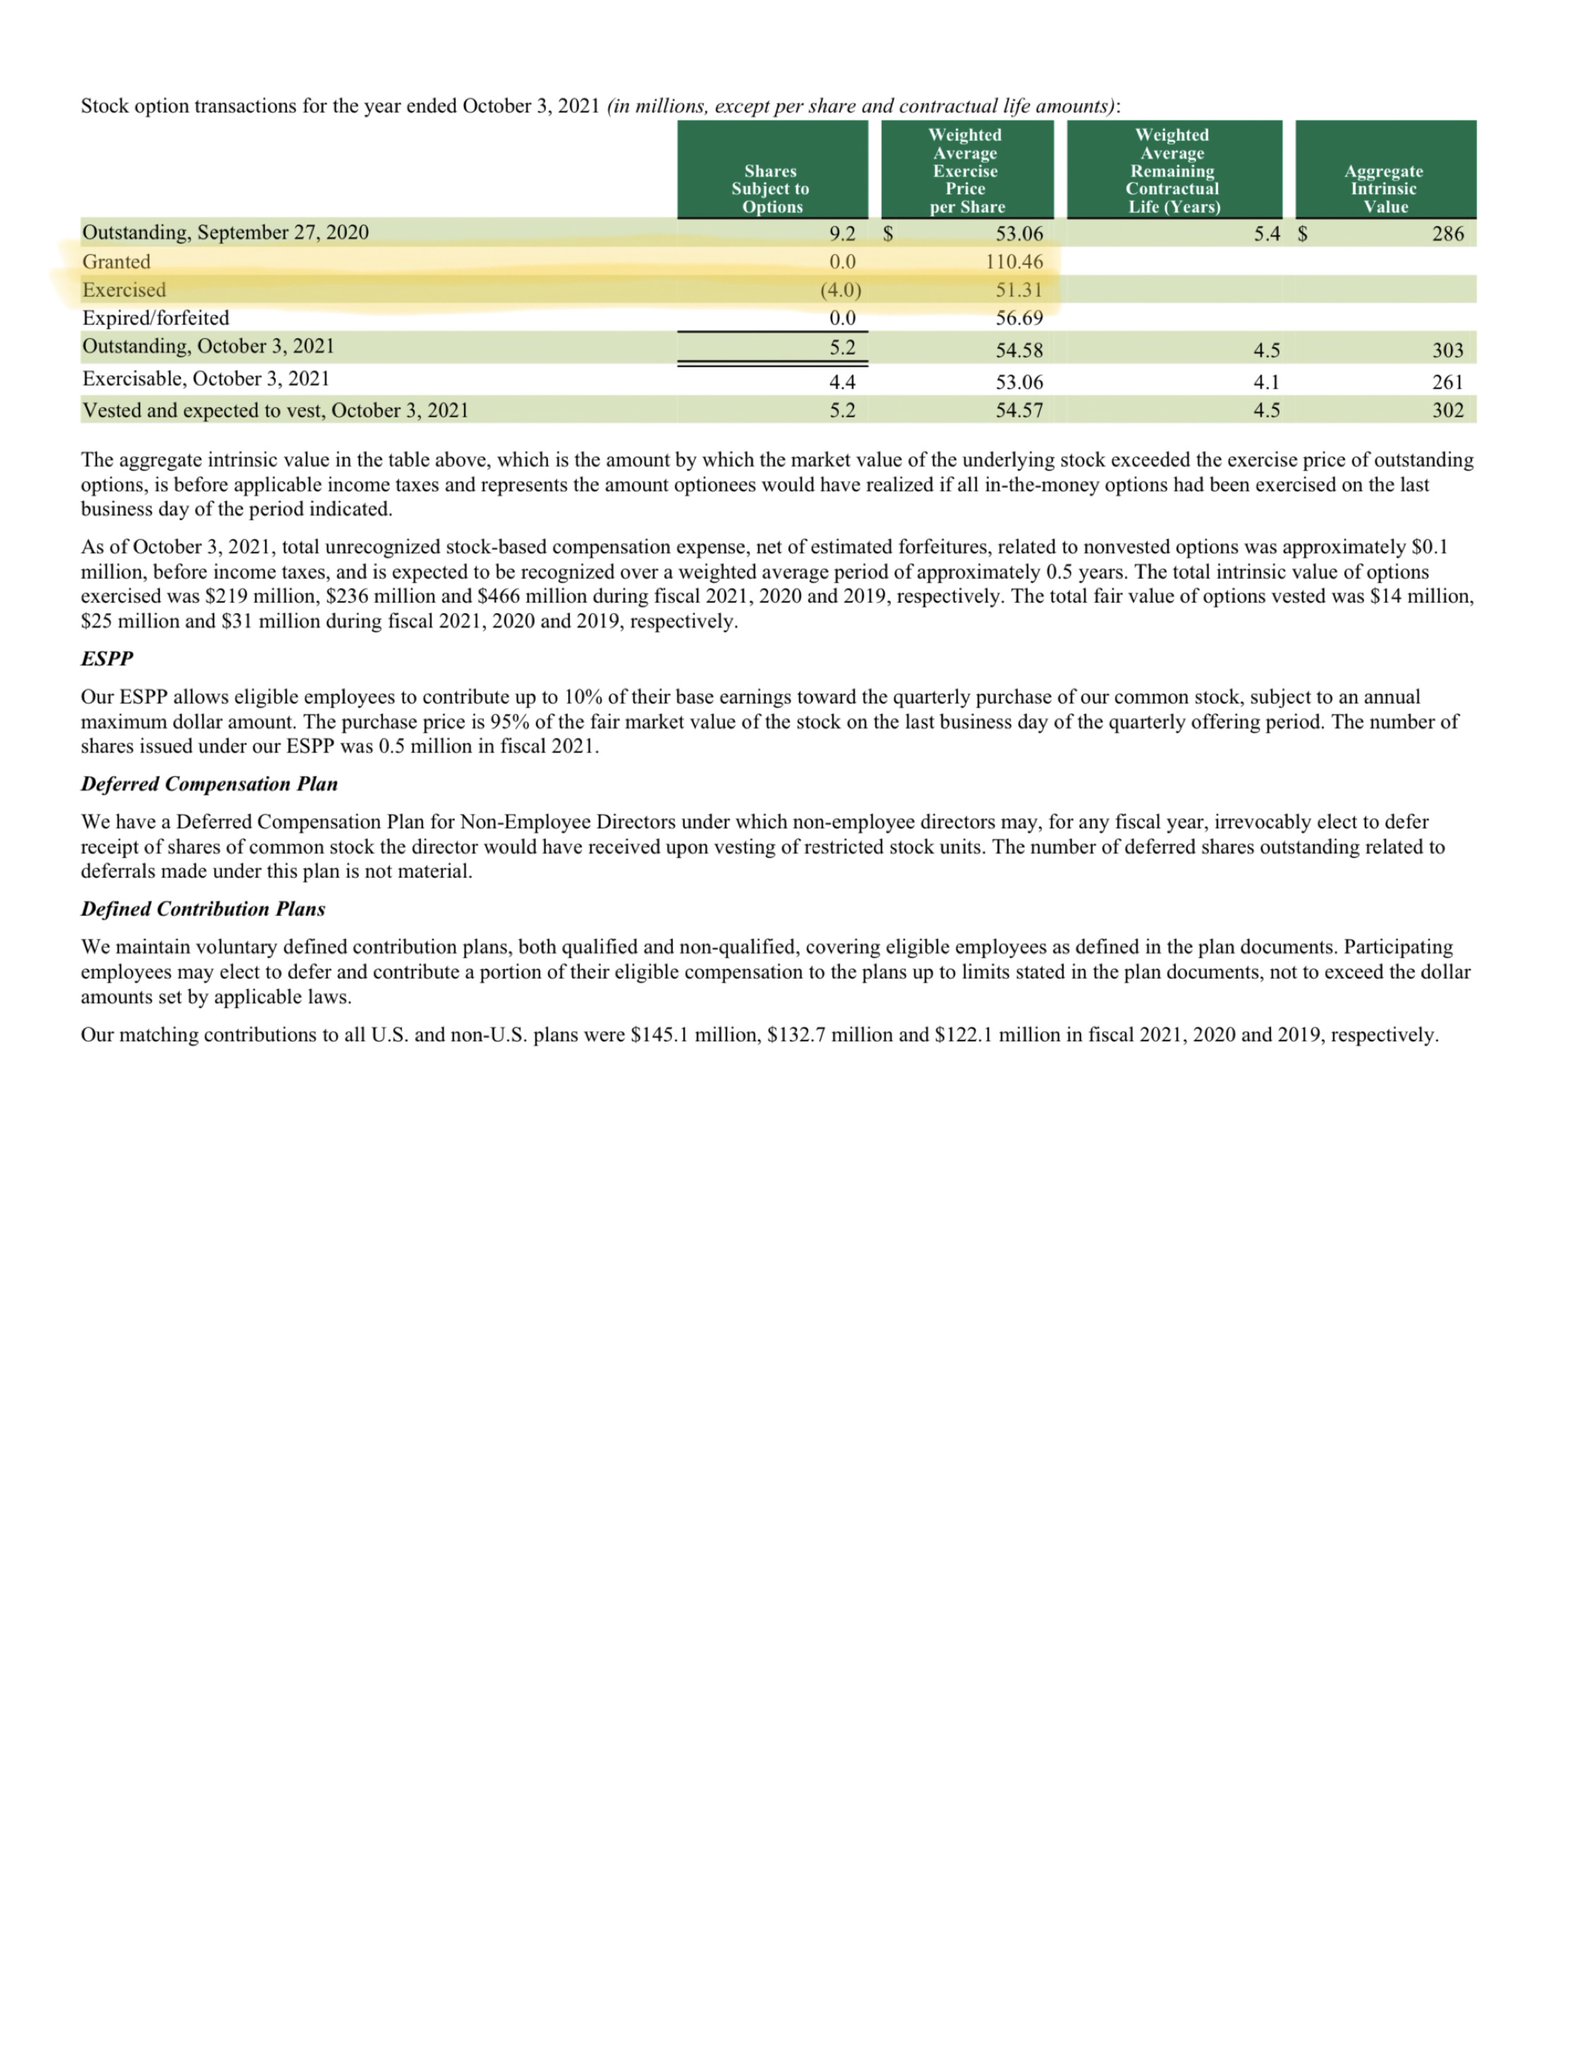
*And* the SBC section of the 10-K.
For example, this tells us that Starbucks granted 4.1M shares as SBC in 2021. That's about (1/3)'rd of 1% of the company. Doesn't seem too egregious.
So, we study the SBC and Share Issuance/Buybacks lines on the Cash Flow Statement.
*And* the SBC section of the 10-K.
For example, this tells us that Starbucks granted 4.1M shares as SBC in 2021. That's about (1/3)'rd of 1% of the company. Doesn't seem too egregious.
26/
One last caveat:
Many modern companies develop new products via R&D, acquire new customers via advertising, etc.
But these cash outflows are usually *expensed* right away, not *depreciated* over time.
This can lead to profits being *understated* on Income Statements.
One last caveat:
Many modern companies develop new products via R&D, acquire new customers via advertising, etc.
But these cash outflows are usually *expensed* right away, not *depreciated* over time.
This can lead to profits being *understated* on Income Statements.
27/
So, we may have to *adjust* Income Statement numbers to better reflect economic reality.
For more, please see Tweets 25 through 29 of this thread:
So, we may have to *adjust* Income Statement numbers to better reflect economic reality.
For more, please see Tweets 25 through 29 of this thread:
28/
Also, I think this paper titled "One Job" by Prof. Michael Mauboussin (@mjmauboussin) describes these Income Statement adjustments beautifully.
Link: www.morganstanley.com/im/publication/insights/articles/articles_onejob.pdf
Also, I think this paper titled "One Job" by Prof. Michael Mauboussin (@mjmauboussin) describes these Income Statement adjustments beautifully.
Link: www.morganstanley.com/im/publication/insights/articles/articles_onejob.pdf
29/
To summarize, here are the 5 Key Metrics I like to look at when studying Income Statements:
1) Sales Growth,
2) Steadiness of Gross Margins,
3) Operating Leverage,
4) Debt Coverage, and
5) Dilution.
To summarize, here are the 5 Key Metrics I like to look at when studying Income Statements:
1) Sales Growth,
2) Steadiness of Gross Margins,
3) Operating Leverage,
4) Debt Coverage, and
5) Dilution.
30/
And here are 6 caveats to keep in mind while reading Income Statements:
1) NOT all growth is good,
2) Operating Leverage MUST diminish,
3) Operating *De-Leverage*,
4) Profits ≠ Cash Flows,
5) Buybacks can mask dilution, and
6) Adjustments for R&D, marketing investments.
And here are 6 caveats to keep in mind while reading Income Statements:
1) NOT all growth is good,
2) Operating Leverage MUST diminish,
3) Operating *De-Leverage*,
4) Profits ≠ Cash Flows,
5) Buybacks can mask dilution, and
6) Adjustments for R&D, marketing investments.
31/
Here's a Money Concepts episode on Income Statements that covers some of these topics in detail.
It's ~1 hour and 40 mins of audio.
Link: callin.com/link/vtbcbGiyBo
Here's a Money Concepts episode on Income Statements that covers some of these topics in detail.
It's ~1 hour and 40 mins of audio.
Link: callin.com/link/vtbcbGiyBo
32/
About Money Concepts
We're a virtual investing club. Our goal is to help each other become better investors.
We meet Sundays at 1pm ET via @getcallin, to discuss all things investing.
Join us. Get the app. Subscribe. Tell your friends.
It's FREE.
www.callin.com/show/money-concepts-DftUtOETKQ
About Money Concepts
We're a virtual investing club. Our goal is to help each other become better investors.
We meet Sundays at 1pm ET via @getcallin, to discuss all things investing.
Join us. Get the app. Subscribe. Tell your friends.
It's FREE.
www.callin.com/show/money-concepts-DftUtOETKQ
33/
If you're still with me, thank you very much!
As investors, we should be fluent at reading, understanding, and interpreting all 3 financial statements.
And I hope this thread helped with the Income Statements part of that.
Please stay safe. Enjoy your weekend!
/End
If you're still with me, thank you very much!
As investors, we should be fluent at reading, understanding, and interpreting all 3 financial statements.
And I hope this thread helped with the Income Statements part of that.
Please stay safe. Enjoy your weekend!
/End
