Thread
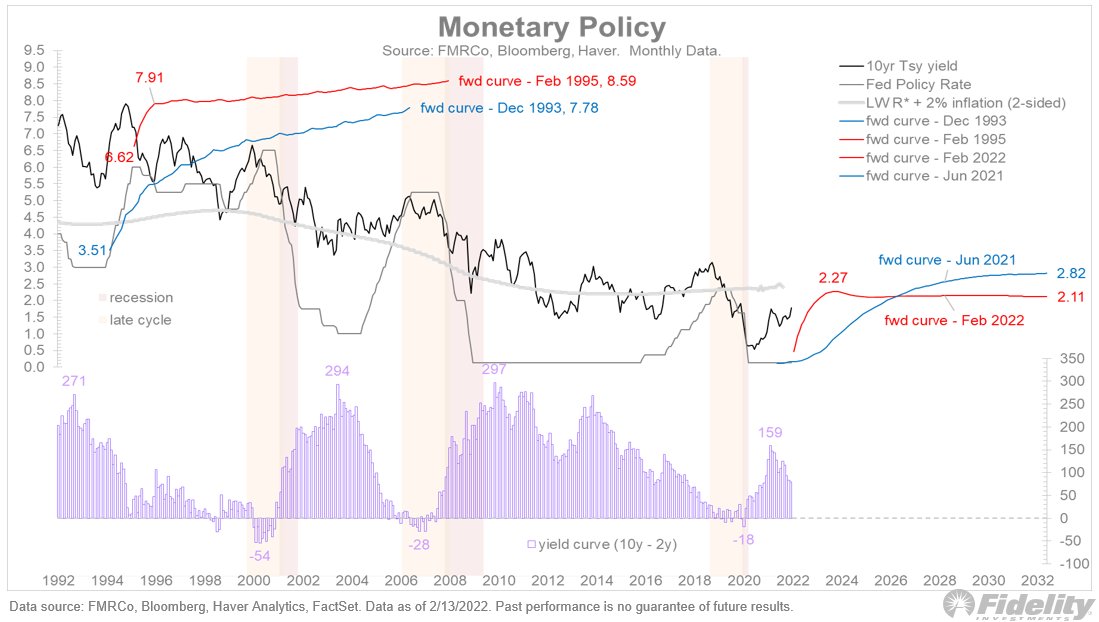
To follow up on my last thread and the riddle of the current Fed cycle: There is a relevant analog: the tightening cycle of 1994. Look at this first chart and we'll dive in: 🧵
The 300-basis-point tightening in 1994 came out of the blue and included several hikes of more than 25 basis points. So, it’s a relevant analog to today, and perhaps a better one than 2015-18. /2
The chart above shows what the market was expecting from the Fed at the end of 1993, just before its first rate hike (which was in February 1994), and 300 bps later at the end of the cycle in February 1995. /3
As you can see, the Eurodollar curve was positively sloped in both cases, and even after 300 basis points of rate hikes, the market expected another 129 basis points of hikes over the subsequent year. But then the Fed stopped, just shy of inverting the curve. /4
Contrast this with today. Last June, the forward curve priced in a very gradual normalization path towards an eventual neutral policy of around 2.5%, based on the Fed’s dot plot and R-star plus 2% inflation. /5
Now, after all the hawkish jawboning and the persistent barrage of worse-than-expected inflation news, the curve is expected to peak at around 2.25% in 2023 and then gradually fall to 2.11%. /6
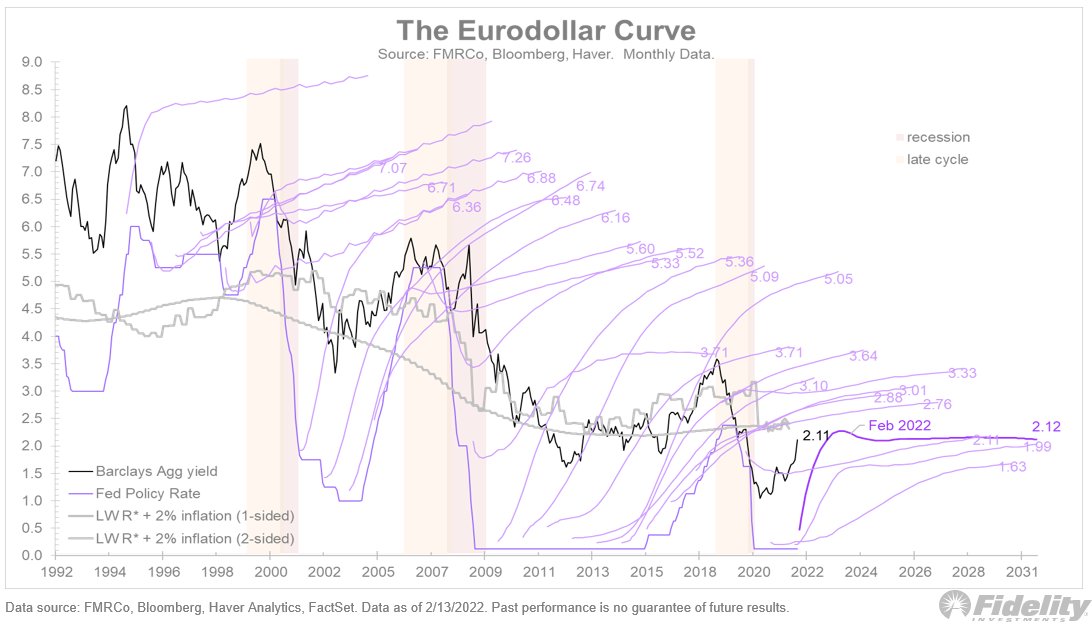
In other words (as this next chart shows), the market is expecting the Fed to tighten roughly eight or nine times (in 25 bps increments), followed by a slight easing of policy, or at least no further tightening. /7


